In today’s competitive business landscape, companies are constantly seeking ways to improve their operational efficiency and drive increased revenue. Optimizing service parts management is an often-overlooked aspect that can have a significant financial impact. Companies can improve overall efficiency and generate significant financial returns by effectively managing spare parts inventory. This article will explore the economic implications of optimized service parts management and how investing in Inventory Optimization and Demand Planning Software can provide a competitive advantage.
The Importance of Optimized Service Parts Planning:
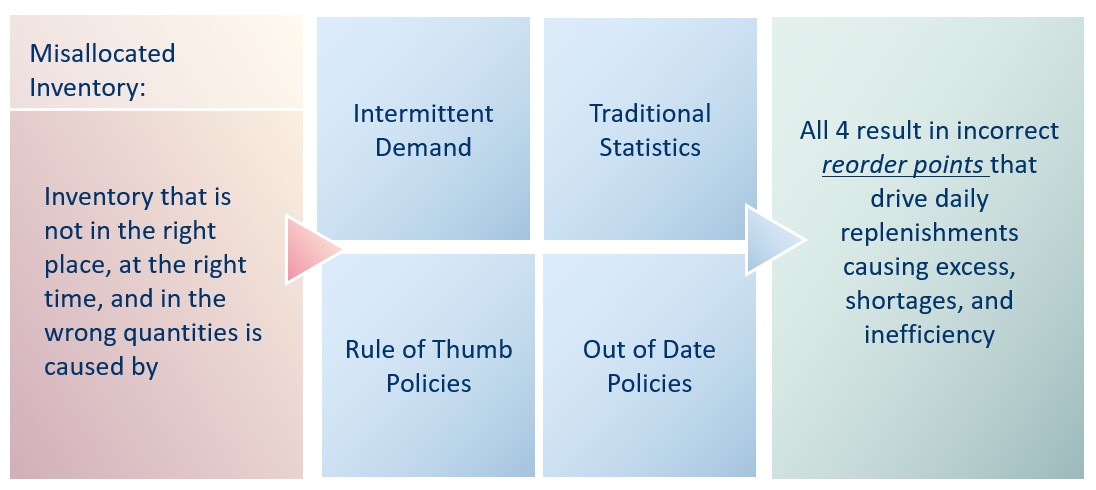
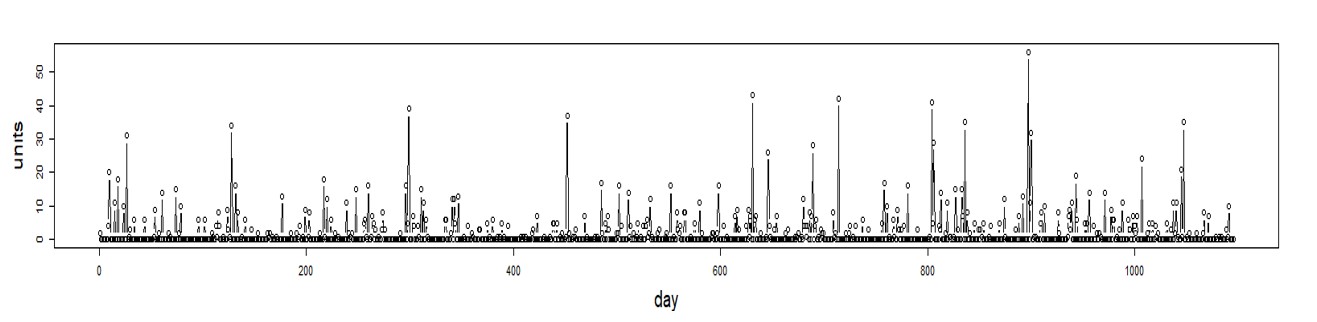
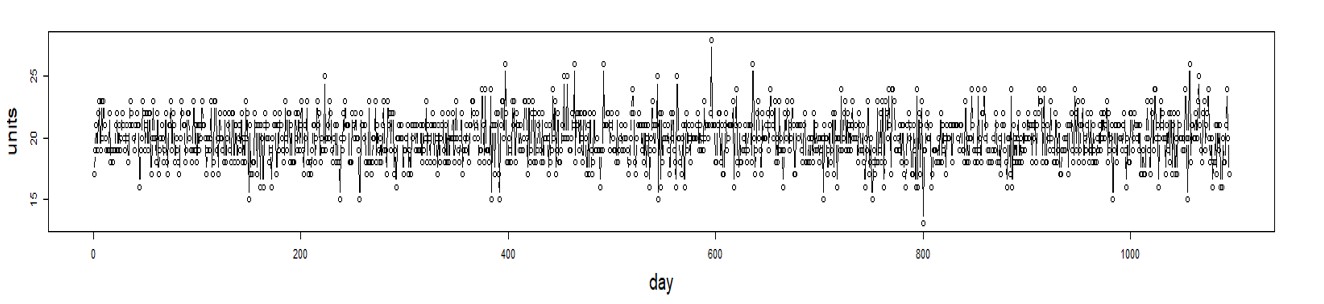
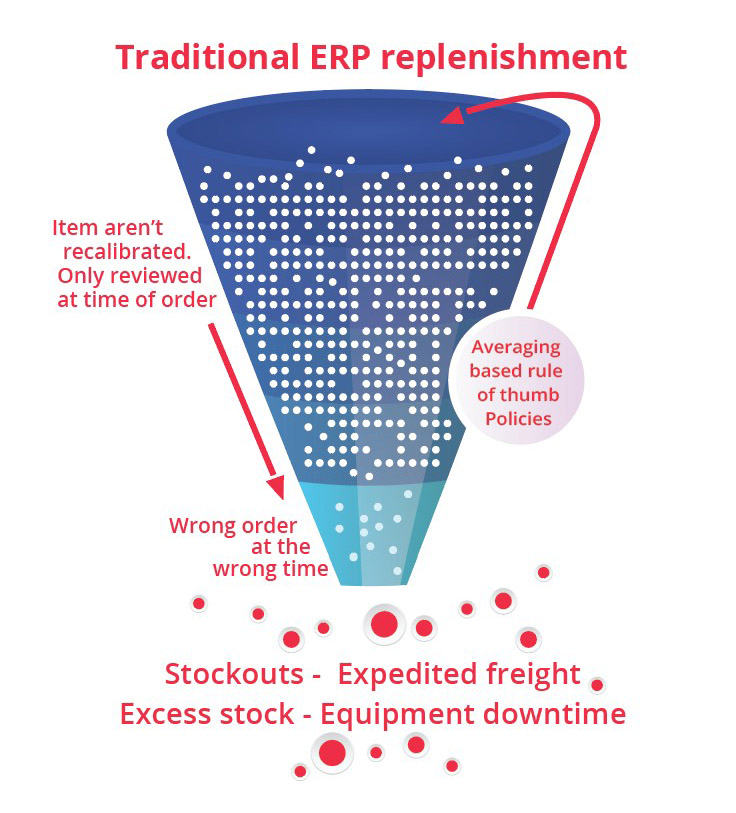
Optimized service parts management plays a vital role in mitigating inventory risks and ensuring critical spare parts availability. While subjective planning may work on a small scale, it becomes insufficient when managing large inventories of intermittently demanded spare parts. Traditional forecasting approaches simply fail to accurately account for the extreme demand variability and frequent periods of zero demand that is so common with spare parts. This results in large misallocations of stock, higher costs, and poor service levels.
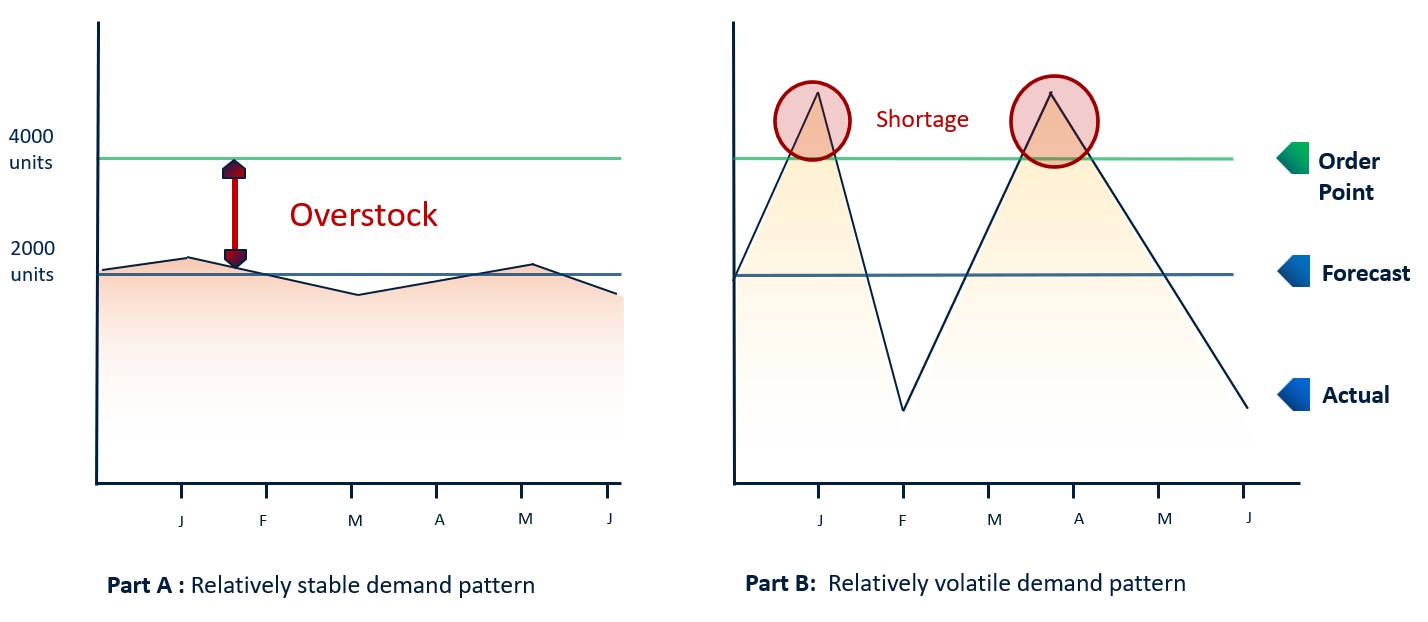
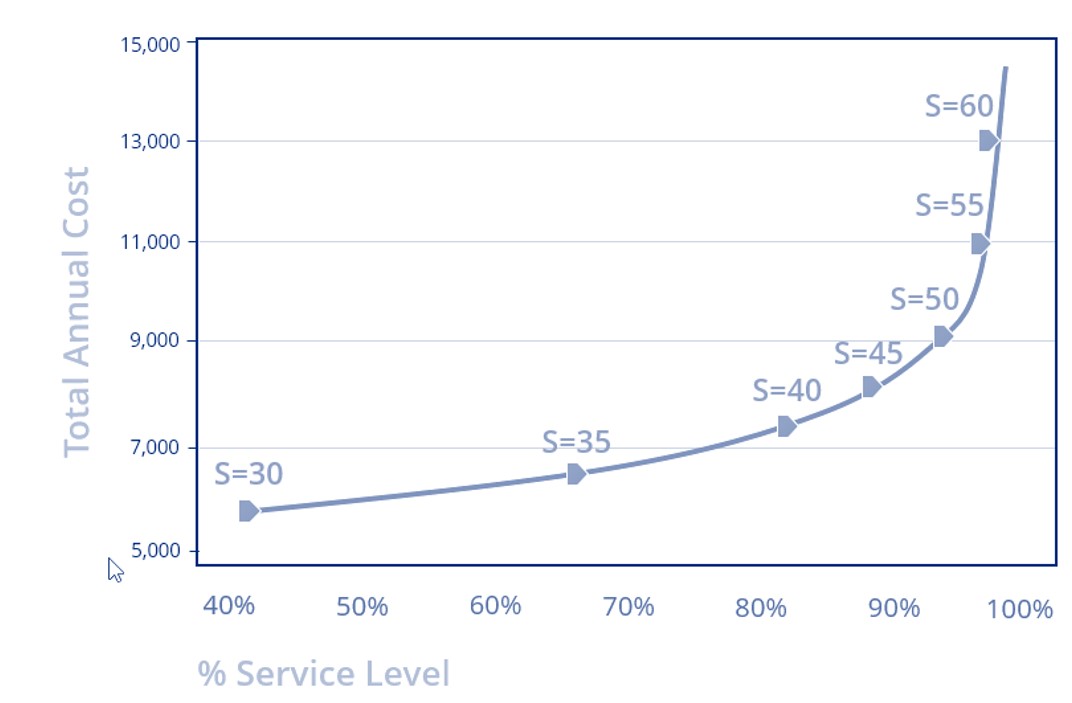
The key to optimized service parts management lies in understanding the trade-off between service and cost. Inventory Optimization and Demand Planning Software powered by probabilistic forecasting and Machine learning Algorithms can help companies better understand the cost vs. benefit of each inventory decision and wield inventory as a competitive asset. By generating accurate demand forecasts and optimal stocking policies such as Min/Max, Safety Stock Levels, and Reorder Points in seconds, companies can know how much is too much and when to add more. By wielding inventory as a competitive asset, companies can drive up service levels and drive down costs.
Improve the Financial Outcome of Spare Parts Planning
- Accurate forecasting is crucial to optimize inventory planning and meet customer demand effectively. State-of-the-art demand planning software accurately predicts inventory requirements, even for intermittent demand patterns. By automating forecasting, companies can save time, money, and resources while improving accuracy.
- Meeting customer demand is a critical aspect of service parts management. Companies can enhance customer satisfaction, loyalty, and increase their chances of winning future contracts for the asset-intensive equipment they sell by ensuring the availability of spare parts when needed. Through effective demand planning and inventory optimization, organizations can reduce lead times, minimize stockouts, and maintain service levels, thereby improving the financial impact of all decisions.
- Financial gains can be achieved through optimized service parts planning, including the reduction of inventory and product costs. Excess storage and obsolete inventory can be significant cost burdens for organizations. By implementing best-of-breed inventory optimization software, companies can identify cost-effective solutions, driving up service levels and reducing costs. This leads to improved inventory turnover, reduced carrying costs, and increased profitability.
- Procurement planning is another essential aspect of service parts management. Organizations can optimize inventory levels, reduce lead times, and avoid stockouts by aligning procurement and the associated order quantities with accurate demand forecasts. For example, accurate forecasts can be shared with suppliers so that blanket purchase commitments can be made. This provides the supplier revenue certainty and, in exchange, can hold more inventory, thereby reducing lead times.
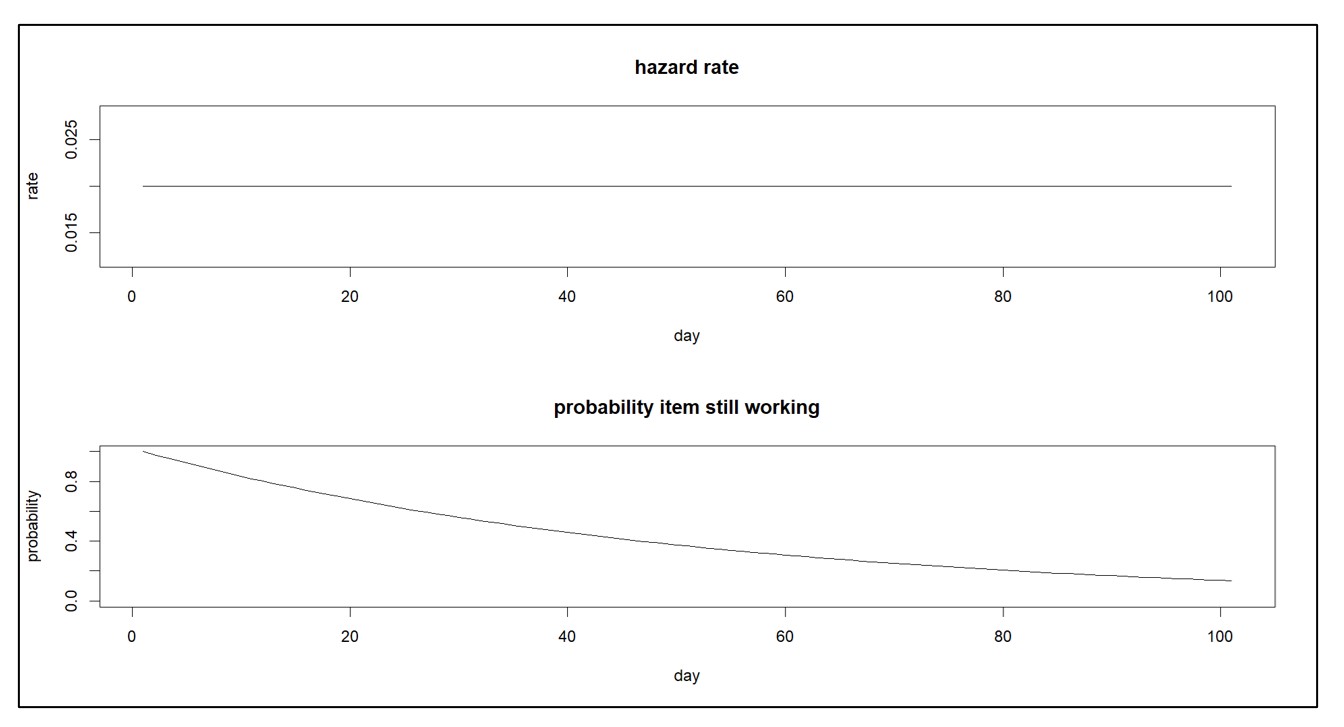
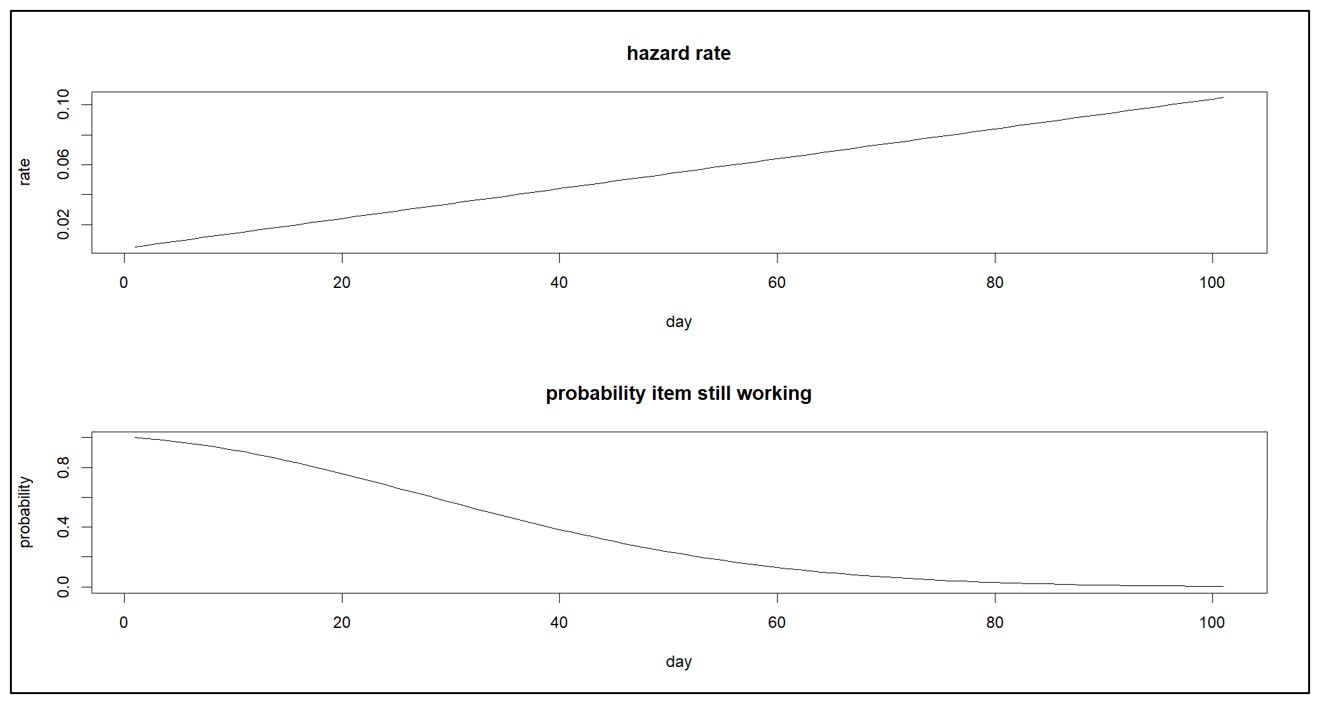
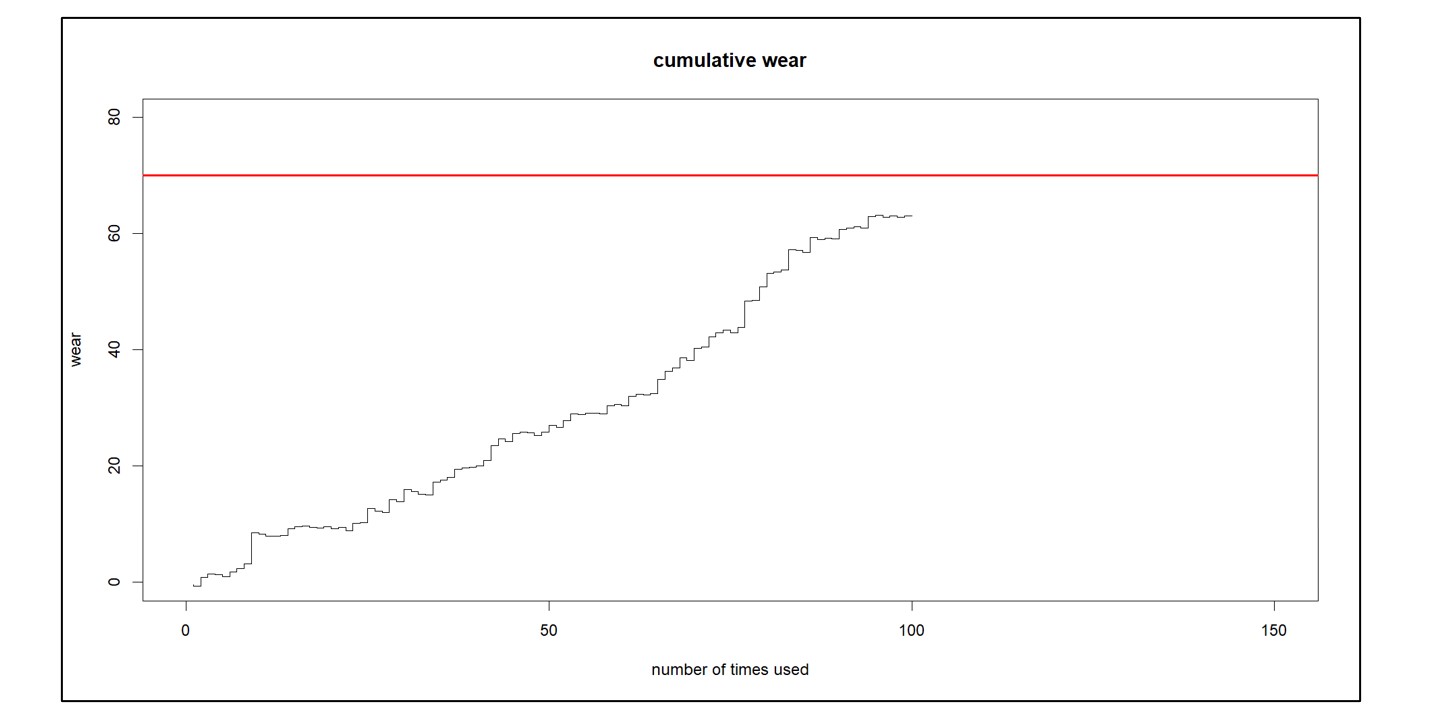
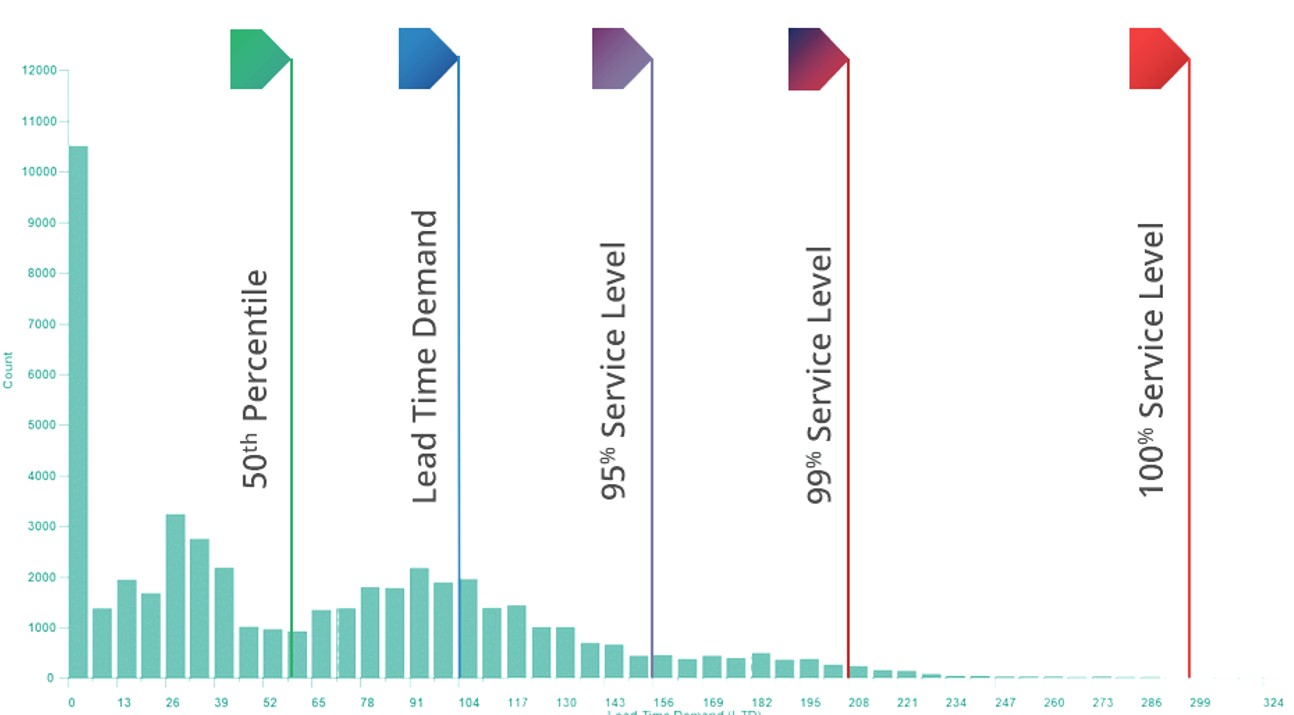
- Intermittent demand planning is a particular challenge in spare parts management. Conventional rule-of-thumb approaches fall short in handling demand variability effectively. This is because traditional approaches assume demand is normally distributed when in reality, it is anything but normal. Spare parts demand random bursts of large demand intersperse many period of zero demand. Smart Software’s solution incorporates advanced statistical models and machine learning algorithms to analyze historical demand patterns, enabling accurate planning for intermittent demand. Companies can significantly reduce stockout costs and improve efficiency by addressing this challenge.
Evidence from Smart Software’s Customers:
Investing in Smart Software’s Inventory Optimization and Demand Planning Software enables companies to unlock cost savings, elevate customer service levels, and enhance operational efficiency. Through accurate demand forecasting, optimized inventory management, and streamlined procurement processes, organizations can achieve financial savings, meet customer demands effectively, and improve overall business performance.
- Metro-North Railroad (MNR) experienced an 8% reduction in parts inventory, reaching a record high customer service level of 98.7%, and reduced inventory growth for new equipment from a projected 10% to only 6%. Smart Software played a crucial role in identifying multi-year service part needs, reducing administrative lead times, formulating stock reduction plans for retiring fleets, and identifying inactive inventory for disposal. MNR saved costs, maximized disposal benefits, improved service levels, and gained accurate insights for informed decision-making, ultimately improving their bottom line and customer satisfaction.
- Seneca Companies, an industry leader in automotive petroleum services, adopted Smart Software to model customer demand, control inventory performance, and drive replenishment. Field service technicians embraced its use, and total inventory investment decreased by more than 25%, from $11 million to $8 million, while maintaining first-time fix rates of 90%+.
- A leading Electric Utility implemented Smart IP&O in just 3 months and then used the software to optimize its reorder points and order quantities for over 250,000 spare parts. During the first phase of the implementation, the platform helped the Utility reduce inventory by $9,000,000 while maintaining service levels. The implementation was part of the company’s strategic supply chain optimization initiative.
Optimizing Service Parts Planning for Competitive Advantage
Optimized service parts management is crucial for companies seeking to improve efficiency, reduce costs, and ensure the availability of necessary spare parts. Organizations can unlock significant value in this field by investing in Smart Software’s Inventory Optimization and Demand Planning Software. Companies can achieve better financial performance and gain a competitive edge in their respective markets through improved data analysis, automation, and inventory planning.
Smart Software is designed for the modern marketplace, which is volatile and always changing. It can handle SKU proliferation, longer supply chains, less predictable lead times, and more intermittent and less forecastable demand patterns. It can also integrate with virtually every ERP solution on the market, by field-proven seamless connections or using a simple import/export process supported by Smart Software’s data model and data processing engine. By using Smart Software, companies can leverage inventory as a competitive asset, enhance customer satisfaction, drive up service levels, push down costs, and save substantial money.
Spare Parts Planning Software solutions
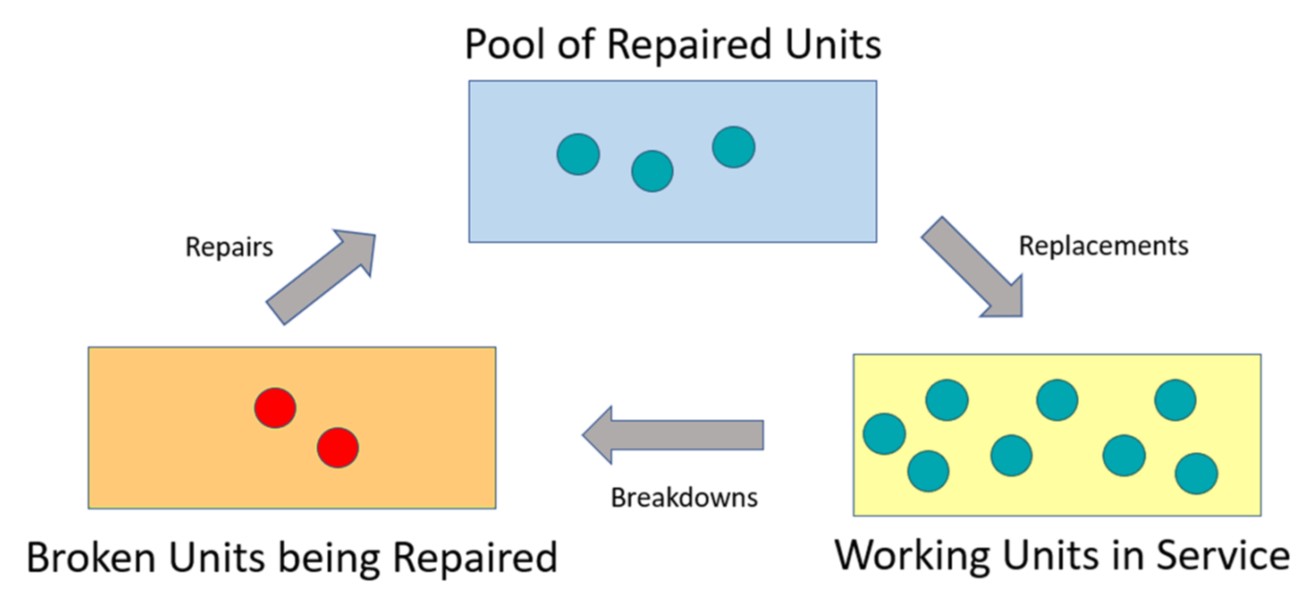
Smart IP&O’s service parts forecasting software uses a unique empirical probabilistic forecasting approach that is engineered for intermittent demand. For consumable spare parts, our patented and APICS award winning method rapidly generates tens of thousands of demand scenarios without relying on the assumptions about the nature of demand distributions implicit in traditional forecasting methods. The result is highly accurate estimates of safety stock, reorder points, and service levels, which leads to higher service levels and lower inventory costs. For repairable spare parts, Smart’s Repair and Return Module accurately simulates the processes of part breakdown and repair. It predicts downtime, service levels, and inventory costs associated with the current rotating spare parts pool. Planners will know how many spares to stock to achieve short- and long-term service level requirements and, in operational settings, whether to wait for repairs to be completed and returned to service or to purchase additional service spares from suppliers, avoiding unnecessary buying and equipment downtime.
Contact us to learn more how this functionality has helped our customers in the MRO, Field Service, Utility, Mining, and Public Transportation sectors to optimize their inventory. You can also download the Whitepaper here.
White Paper: What you Need to know about Forecasting and Planning Service Parts
This paper describes Smart Software’s patented methodology for forecasting demand, safety stocks, and reorder points on items such as service parts and components with intermittent demand, and provides several examples of customer success.