Just as the renowned astronomer Copernicus transformed our understanding of astronomy by placing the sun at the center of our universe, today, we invite you to re-center your approach to inventory management. And while not quite as enlightening, this advice will help your company avoid being caught in the gravitational pull of inventory woes—constantly orbiting between stockouts, surplus gravity, and the unexpected cosmic expenses of expediting?
In this article, we’ll walk you through the process of crafting a spare parts inventory plan that prioritizes availability metrics such as service levels and fill rates while ensuring cost efficiency. We’ll focus on an approach to inventory planning called Service Level-Driven Inventory Optimization. Next, we’ll discuss how to determine what parts you should include in your inventory and those that might not be necessary. Lastly, we’ll explore ways to enhance your service-level-driven inventory plan consistently.
In service-oriented businesses, the consequences of stockouts are often very significant. Achieving high service levels depends on having the right parts at the right time. However, having the right parts isn’t the only factor. Your Supply Chain Team must develop a consensus inventory plan for every part, then continuously update it to reflect real-time changes in demand, supply, and financial priorities.
Managing inventory with Service-level-driven planning combines the ability to plan thousands of items with high-level strategic modeling. This requires addressing core issues facing inventory executives:
- Lack of control over supply and associated lead times.
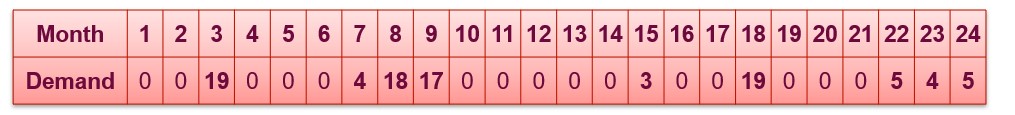
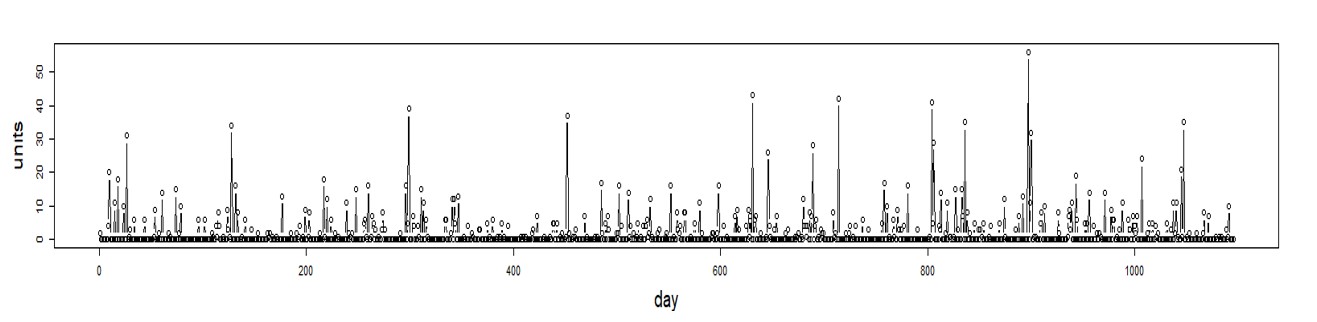
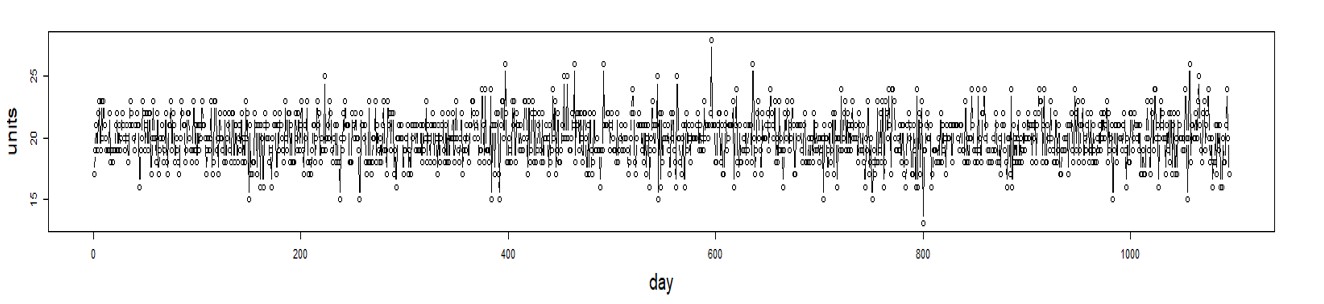
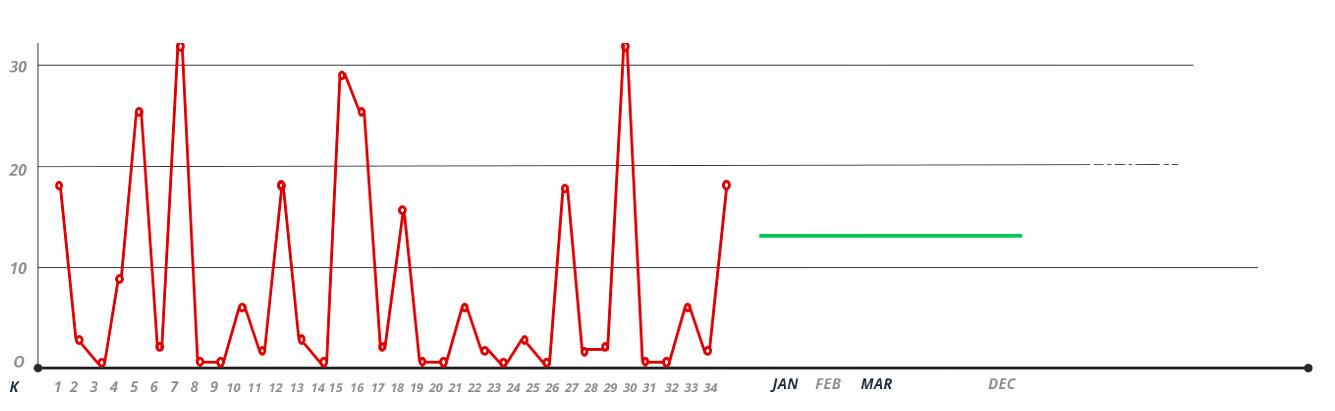
- Unpredictable intermittent demand.
- Conflicting priorities between maintenance/mechanical teams and Materials Management.
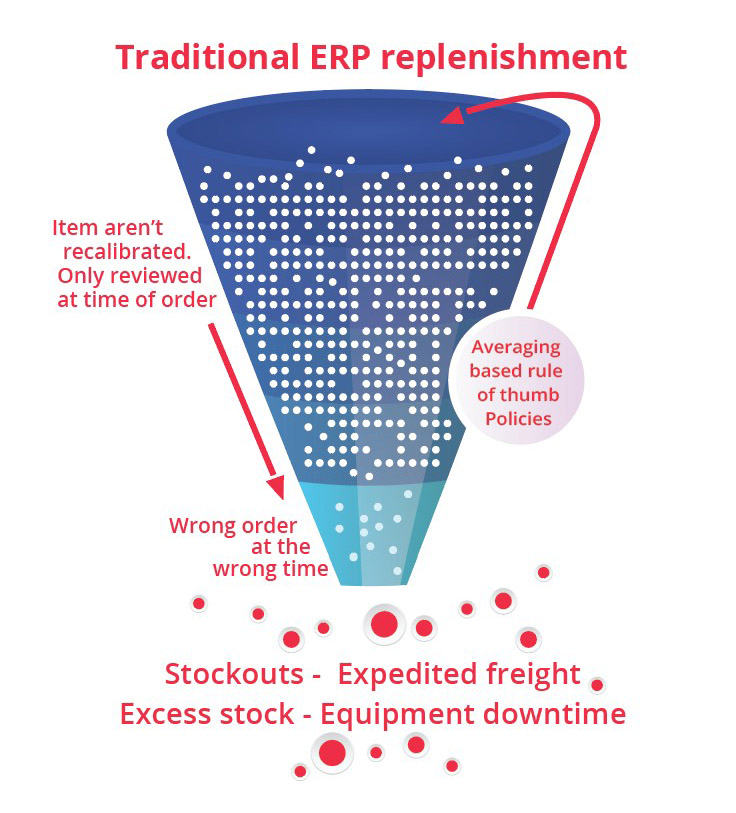
- Reactive “wait and see” approach to planning.
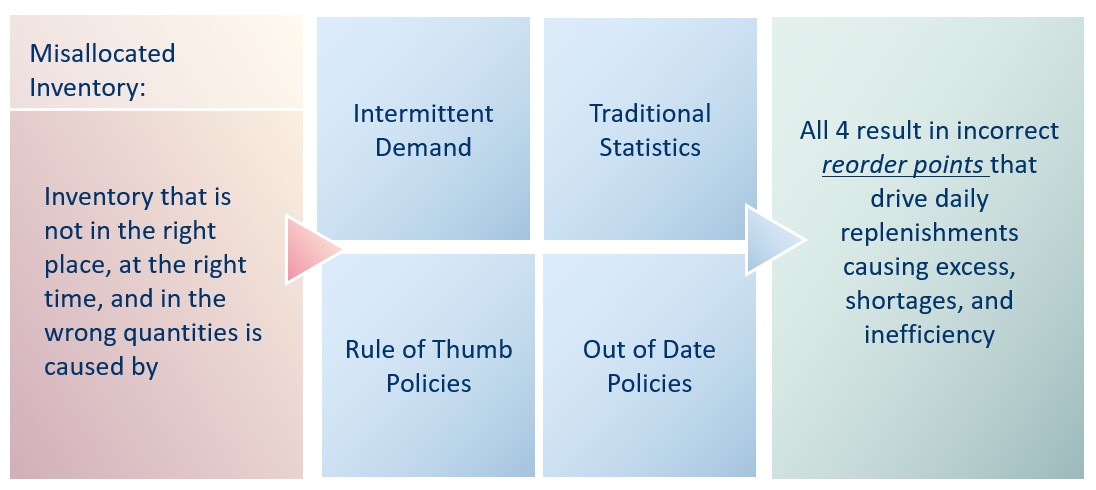
- Misallocated inventory, causing stockouts and excess.
- Lack of trust in systems and processes.
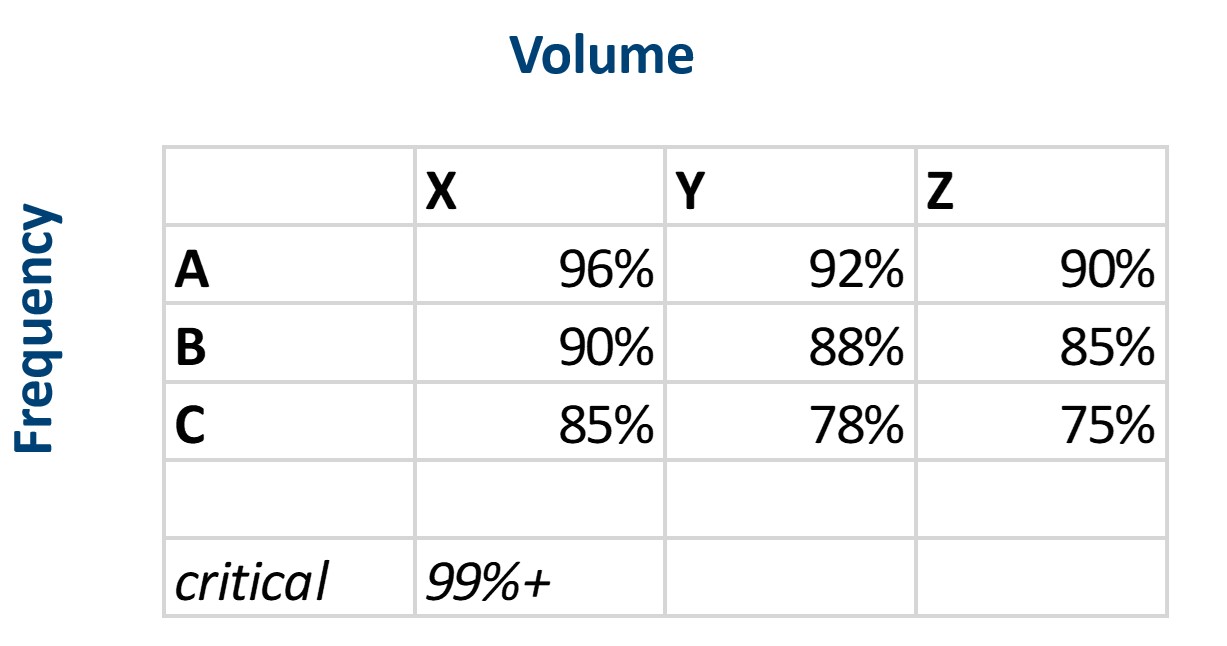
The key to optimal service parts management is to grasp the balance between providing excellent service and controlling costs. To do this, we must compare the costs of stockout with the cost of carrying additional spare parts inventory. The costs of a stockout will be higher for critical or emergency spares, when there is a service level agreement with external customers, for parts used in multiple assets, for parts with longer supplier lead times, and for parts with a single supplier. The cost of inventory may be assessed by considering the unit costs, interest rates, warehouse space that will be consumed, and potential for obsolescence (parts used on a soon-to-be-retired fleet have a higher obsolescence risk, for example).
To arbitrate how much stock should be put on the shelf for each part, it is critical to establish consensus on the desired key metrics that expose the tradeoffs the business must make to achieve the desired KPIs. These KPIs will include Service Levels that tell you how often you meet usage needs without falling short on stock, Fill Rates that tell you what percentage of demand is filled, and Ordering costs detail the expenses incurred when you place and receive replenishment orders. You also have Holding costs, which encompass expenses like obsolescence, taxes, and warehousing, and Shortage costs that pertain to expenses incurred when stockouts happen.
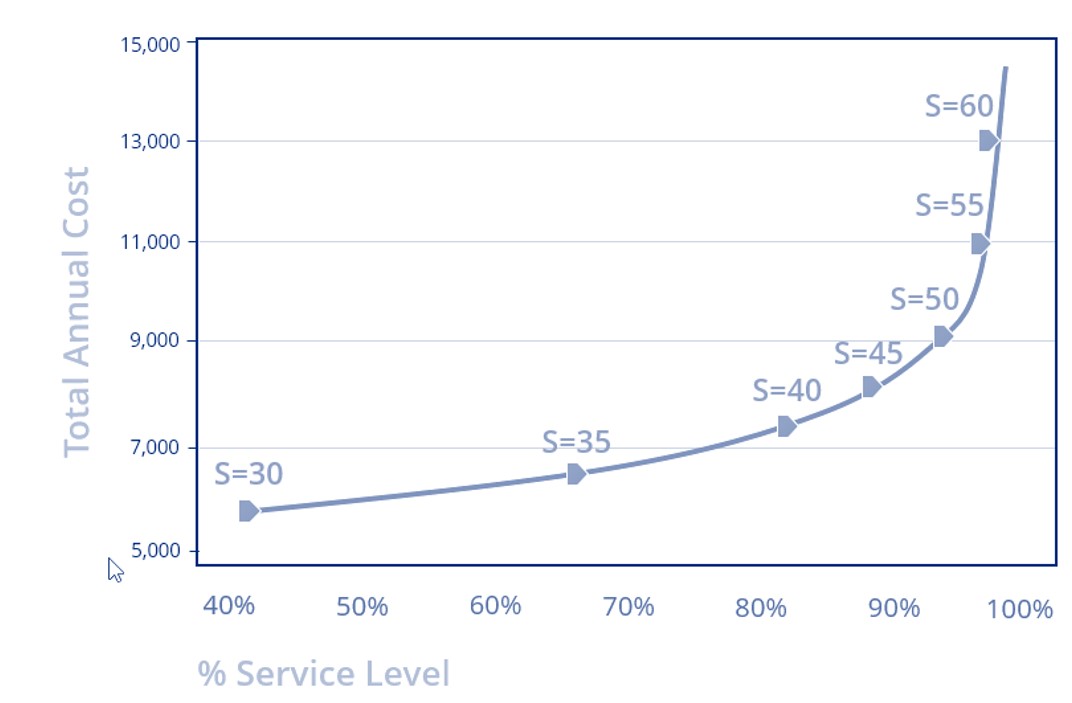
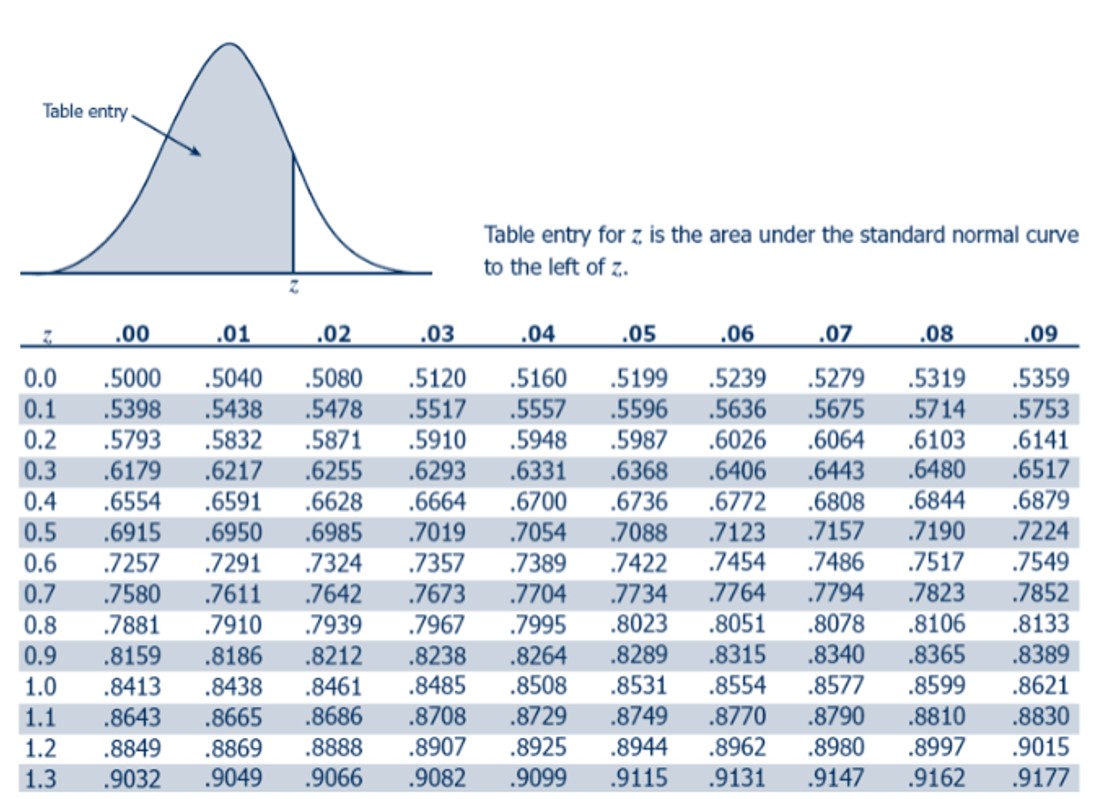
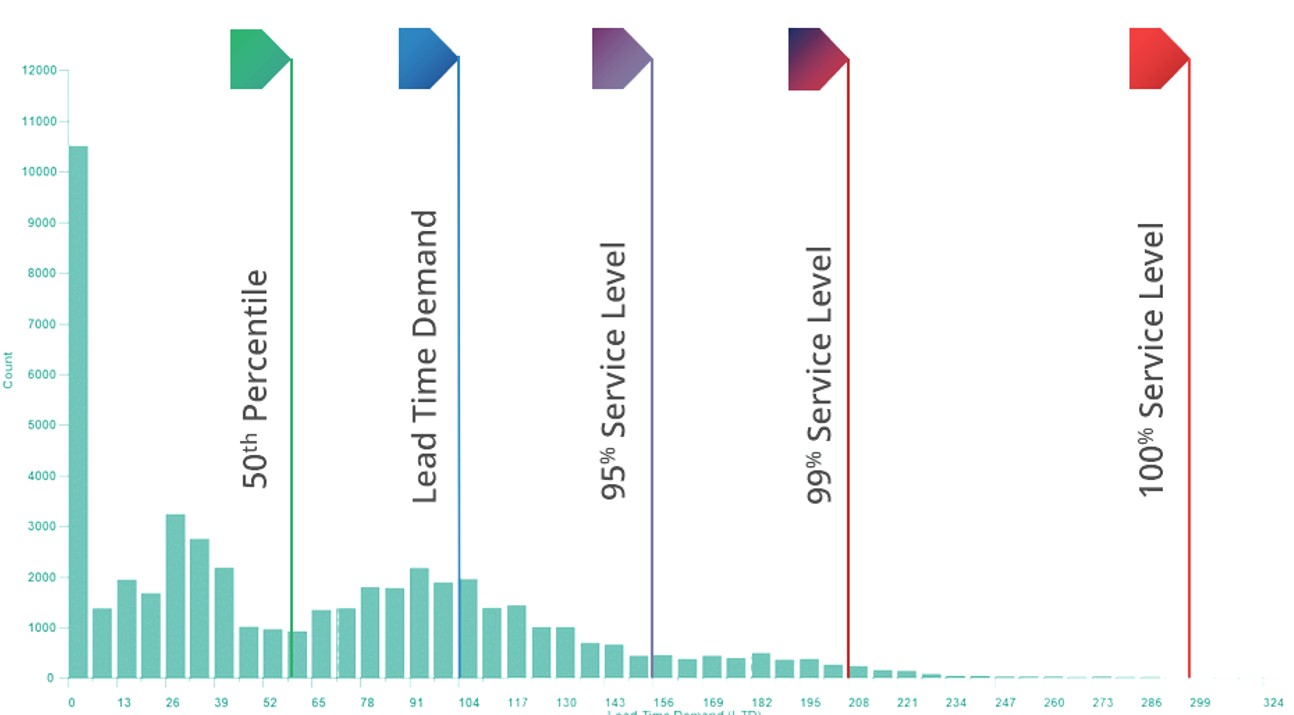
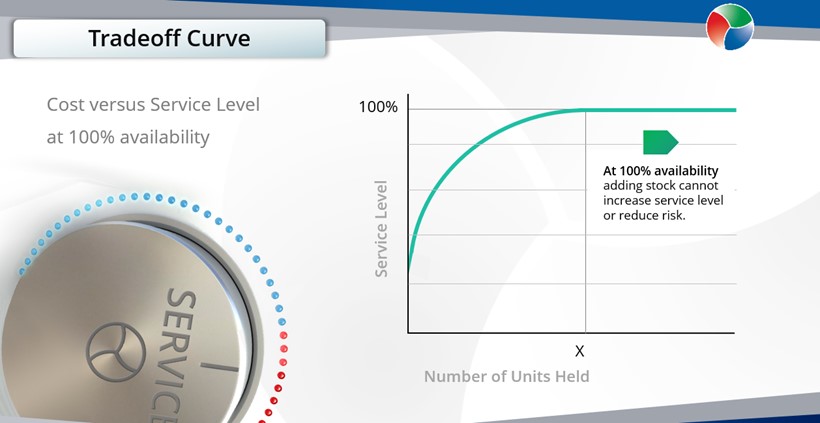
An MRO business or Aftermarket Parts Planning team might desire a 99% service level across all parts – i.e., the minimum stockout risk that they are willing to accept is 1%. But what if the amount of inventory needed to support that service level is too expensive? To make an informed decision on whether there is going to be a return on that additional inventory investment, you’ll need to know the stockout costs and compare that to the inventory costs. To get stockout costs, multiply two key elements: the cost per stockout and the projected number of stockouts. To get inventory value, multiply the units required by the unit cost of each part. Then determine the annual holding costs (typically 25-35% of the unit cost). Choose the option that yields a total lower cost. In other words, if the benefit associated with adding more stock (reduced shortage costs) outweighs the cost (higher inventory holding costs), then go for it. A thorough understanding of these metrics and the associated tradeoffs serves as the compass for decision-making.
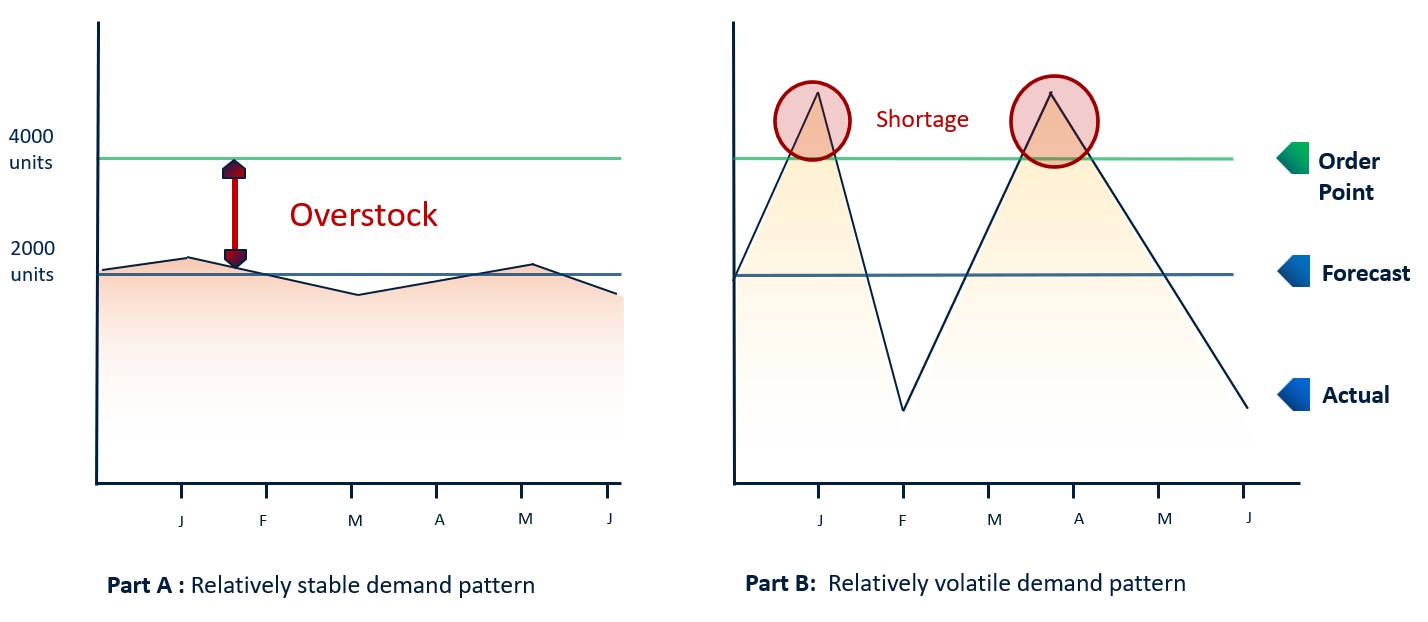
Modern software aids in this process by allowing you to simulate a multitude of future scenarios. By doing so, you can assess how well your current inventory stocking strategies are likely to perform in the face of different demand and supply patterns. If anything falls short or goes awry, it’s time to recalibrate your approach, factoring in current data on usage history, supplier lead times, and costs to prevent both stockouts and overstock situations.
Enhance your service-level-driven inventory plan consistently.
In conclusion, it’s crucial to assess your service-level-driven plan continuously. By systematically constructing and refining performance scenarios, you can define key metrics and goals, benchmark expected performance, and automate the calculation of stocking policies for all items. This iterative process involves monitoring, revising, and repeating each planning cycle.
The depth of your analysis within these stocking policies relies on the data at your disposal and the configuration capabilities of your planning system. To achieve optimal outcomes, it’s imperative to maintain ongoing data analysis. This implies that a manual approach to data examination is typically insufficient for the needs of most organizations.
For information on how Smart Software can help you meet your service supply chain goals with service-driven planning and more, visit the following blogs.
– “Explaining What Service-Level Means in Your Inventory Optimization Software” Stocking recommendations can be puzzling, especially when they clash with real-world needs. In this post, we’ll break down what that 99% service level means and why it’s crucial for managing inventory effectively and keeping customers satisfied in today’s competitive landscape.
– “Service-Level-Driven Planning for Service Parts Businesses” Service-Level-Driven Service Parts Planning is a four-step process that extends beyond simplified forecasting and rule-of-thumb safety stocks. It provides service parts planners with data-driven, risk-adjusted decision support.
– “How to Choose a Target Service Level.” This is a strategic decision about inventory risk management, considering current service levels and fill rates, replenishment lead times, and trade-offs between capital, stocking and opportunity costs. Learn approaches that can help.
– “The Right Forecast Accuracy Metric for Inventory Planning.” Just because you set a service level target doesn’t mean you’ll actually achieve it. If you are interested in optimizing stock levels, focus on the accuracy of the service level projection. Learn how.
Spare Parts Planning Software solutions
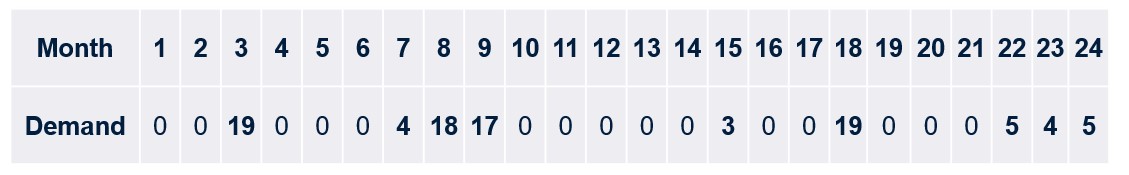
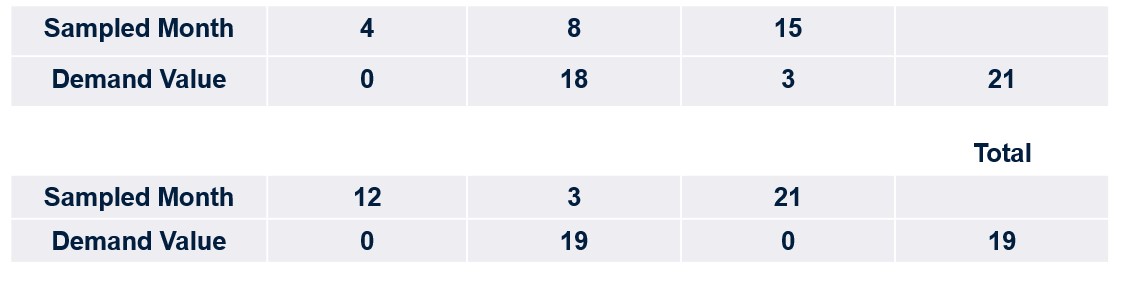
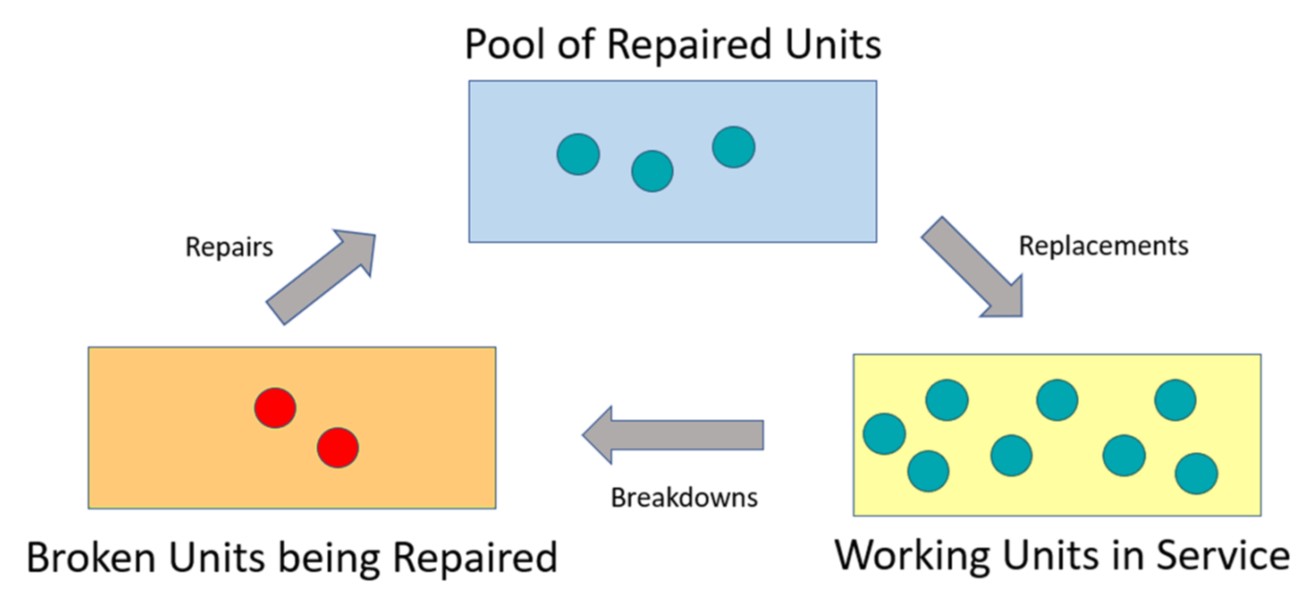
Smart IP&O’s service parts forecasting software uses a unique empirical probabilistic forecasting approach that is engineered for intermittent demand. For consumable spare parts, our patented and APICS award winning method rapidly generates tens of thousands of demand scenarios without relying on the assumptions about the nature of demand distributions implicit in traditional forecasting methods. The result is highly accurate estimates of safety stock, reorder points, and service levels, which leads to higher service levels and lower inventory costs. For repairable spare parts, Smart’s Repair and Return Module accurately simulates the processes of part breakdown and repair. It predicts downtime, service levels, and inventory costs associated with the current rotating spare parts pool. Planners will know how many spares to stock to achieve short- and long-term service level requirements and, in operational settings, whether to wait for repairs to be completed and returned to service or to purchase additional service spares from suppliers, avoiding unnecessary buying and equipment downtime.
Contact us to learn more how this functionality has helped our customers in the MRO, Field Service, Utility, Mining, and Public Transportation sectors to optimize their inventory. You can also download the Whitepaper here.
White Paper: What you Need to know about Forecasting and Planning Service Parts
This paper describes Smart Software’s patented methodology for forecasting demand, safety stocks, and reorder points on items such as service parts and components with intermittent demand, and provides several examples of customer success.