Correlation vs Causation: Is This Relevant to Your Job?

Outside of work, you may have heard the famous dictum “Correlation is not causation.” It may sound like a piece of theoretical fluff that, though involved in a recent Noble Prize in economics, isn’t relevant to your work as a demand planner. Is so, you may be only partially correct.

Extrapolative vs Causal Models

Most demand forecasting uses extrapolative models. Also called time-series models, these forecast demand using only the past values of an item’s demand. Plots of past values reveal trend and seasonality and volatility, so there is a lot they are good for. But there is another type of model – causal models —that can potentially improve forecast accuracy beyond what you can get from extrapolative models.

Causal models bring more input data to the forecasting task: information on presumed forecast “drivers” external to the demand history of an item. Examples of potentially useful causal factors include macroeconomic variables like the inflation rate, the rate of GDP growth, and raw material prices. Examples not tied to the national economy include industry-specific growth rates and your own and competitors’ ad spending.  These variables are usually used as inputs to regression models, which are equations with demand as an output and causal variables as inputs.

Forecasting using Causal Models

Many firms have an S&OP process that involves a monthly review of statistical (extrapolative) forecasts in which management adjusts forecasts based on their judgement. Often this is an indirect and subjective way to work causal models into the process without doing the regression modeling.

To actually make a causal regression model, first you have to nominate a list of potentially-useful causal predictor variables. These may come from your subject matter expertise. For example, suppose you manufacture window glass. Much of your glass may end up in new homes and new office buildings. So, the number of new homes and offices being built are plausible predictor variables in a regression equation.

There is a complication here: if you are using the equation to predict something, you must first predict the predictors. For example, sales of glass next quarter may be strongly related to numbers of new homes and new office buildings next quarter. But how many new homes will there be next quarter? That’s its own forecasting problem. So, you have a potentially powerful forecasting model, but you have extra work to do to make it usable.

There is one way to simplify things: if the predictor variables are “lagged” versions of themselves. For example, the number of new building permits issued six months ago may be a good predictor of glass sales next month. You don’t have to predict the building permit data – you just have to look it up.

Is it a causal relationship or just a spurious correlation?

Causal models are the real deal: there is an actual mechanism that relates the predictor variable to the predicted variable. The example of predicting glass sales from building permits is an example.

A correlation relationship is more iffy. There is a statistical association that may or may not provide a solid basis for forecasting. For example, suppose you sell a product that happens to appeal most strongly to Dutch people but you don’t realize this. The Dutch are, on average, the tallest people in Europe. If your sales are increasing and the average height of Europeans is increasing, you might use that relationship to good effect. However, if the proportion of Dutch in the Euro zone is decreasing while the average height is increasing because the mix of men versus women is shifting toward men, what can go wrong? You will expect sales to increase because average height is increasing. But your sales are really mostly to the Dutch, and their relative share of the population is shrinking, so your sales are really going to decrease instead. In this case the association between sales and customer height is a spurious correlation.

How can you tell the difference between true and spurious relationships? The gold standard is to do a rigorous scientific experiment. But you are not likely to be in position to do that. Instead, you have to rely on your personal “mental model” of how your market works. If your hunches are right, then your potential causal models will correlate with demand and causal modeling will pay off for you, either to supplement extrapolative models or to replace them.


What data is needed to support Demand Planning Software Implementations

We recently met with the IT team at one of our customers to discuss data requirements and installation of our API based integration that would pull data from their on-premises installation of their ERP system.   The IT manager and analyst both expressed significant concern about providing this data and seriously questioned why it needed to be provided at all.  They even voiced concerns that their data might be resold to their competition. Their reaction was a big surprise to us.  We wrote this blog with them in mind and to make it easier for others to communicate why certain data is necessary to support an effective demand planning process. 

Please note that if you are a forecast analyst, demand planner, of supply chain professional then most of what you’ll read below will be obvious.  But what this meeting taught me is that what is obvious to one group of specialists isn’t going to be obvious to another group of specialists in an entirely different field. 

The Four main types of data that are needed are:  

  1. Historical transactions, such as sales orders and shipments.
  2. Job usage transactions, such as what components are needed to produce finished goods
  3. Inventory Transfer transactions, such as what inventory was shipped from one location to another.
  4. Pricing, costs, and attributes, such as the unit cost paid to the supplier, the unit price paid by the customer, and various meta data like product family, class, etc.  

Below is a brief explanation of why this data is needed to support a company’s implementation of demand planning software.

Transactional records of historical sales and shipments by customer
Think of what was drawn out of inventory as the “raw material” required by demand planning software.  This can be what was sold to whom and when or what you shipped to whom and when.  Or what raw materials or subassemblies were consumed in work orders and when.  Or what is supplied to a satellite warehouse from a distribution center and when.

The history of these transactions is analyzed by the software and used to produce statistical forecasts that extrapolate observed patterns.  The data is evaluated to uncover patterns such as trend, seasonality, cyclical patterns, and to identify potential outliers that require business attention.  If this data is not generally accessible or updated in irregular intervals, then it is nearly impossible to create a good prediction of the future demand.  Yes, you could use business knowledge or gut feel but that doesn’t scale and nearly always introduces bias into the forecast (i.e., consistently forecasting too high or too low). 

Data is needed at the transactional level to support finer grained forecasting at the weekly or even daily levels.  For example, as a business enters its busy season it may want to start forecasting weekly to better align production to demand.  You can’t easily do that without having the transactional data in a well-structured data warehouse. 

It might also be the case that certain types of transactions shouldn’t be included in demand data.  This can happen when demand results from a steep discount or some other circumstance that the supply chain team knows will skew the results.  If the data is provided in the aggregate, it is much harder to segregate these exceptions.  At Smart Software, we call the process of figuring out which transactions (and associated transactional attributes) should be counted in the demand signal as “demand signal composition.” Having access to all the transactions enables a company to modify their demand signal as needed over time within the software.  Only providing some of the data results in a far more rigid demand composition that can only be remedied with additional implementation work.

Pricing and Costs
The price you sold your products for and the cost you paid to procure them (or raw materials) is critical to being able to forecast in revenue or costs.  An important part of the demand planning process is getting business knowledge from customers and sales teams.  Sales teams tend to think of demand by customer or product category and speak in the language of dollars.  So, it is important to express a forecast in dollars.  The demand planning system cannot do that if the forecast is shown in units only. 

Often, the demand forecast is used to drive or at least influence a larger planning & budgeting process and the key input to a budget is a forecast of revenue.  When demand forecasts are used to support the S&OP process, the Demand Planning software should either average pricing across all transactions or apply “time-phased” conversions that consider the price sold at that time.   Without the raw data on pricing and costs, the demand planning process can still function, but it will be severely impaired. 

Product attributes, Customer Details, and Locations
Product attributes are needed so that forecasters can aggregate forecasts across different product families, groups, commodity codes, etc. It is helpful to know how many units and total projected dollarized demand for different categories.  Often, business knowledge about what the demand might be in the future is not known at the product level but is known at the product family level, customer level, or regional level.  With the addition of product attributes to your demand planning data feed, you can easily “roll up” forecasts from the item level to a family level.  You can convert forecasts at these levels to dollars and better collaborate on how the forecast should be modified.  

Once the knowledge is applied in the form of a forecast override, the software will automatically reconcile the change to all the individual items that comprise the group.  This way, a forecast analyst doesn’t have to individually adjust every part.  They can make a change at the aggregate level and let the demand planning software do the reconciliation for them. 

Grouping for ease of analysis also applies to customer attributes, such as assigned salesperson or a customer’s preferred ship from location.  And location attributes can be useful, such as assigned region.  Sometimes attributes relate to a product and location combination, like preferred supplier or assigned planner, which can differ for the same product depending on warehouse.


A final note on confidentiality

Recall that our customer expressed concern that we might sell their data to a competitor. We would never do that. For decades, we have been using customer data for training purposes and for improving our products. We are scrupulous about safeguarding customer data and anonymizing anything that might be used, for instance, to illustrate a point in a blog post.


Types of forecasting problems we help solve

Here are examples of forecasting problems that SmartForecasts can solve, along with the kinds of business data representative of each.

Forecasting an item based on its pattern

Given the following six quarterly sales figures, what sales can you expect for the third and fourth quarters of 2023?

Forecasting an item based on its pattern

Sales by Quarter

SmartForecasts gives you many ways to approach this problem. You can make your own statistical forecasts using any of six different exponential smoothing and moving average methods. Or, like most nontechnical forecasters, you can use the time-saving Automatic command, which has been programmed to automatically select and use the most accurate method for your data. Finally, to incorporate your business judgment into the forecasting process, you can graphically adjust any statistical forecast result using SmartForecasts’ “eyeball” adjustment capabilities.


Forecasting an item based on its relationship to other variables.

Given the following historical relationship between unit sales and the number of sales representatives, what sales levels can you expect when the planned increase in sales staff takes place over the final two quarters of 2023?

Forecasting an item based on its relationship to other variables.

Sales and Sales Representatives by Quarter

You can answer a question like this using SmartForecasts’ powerful Regression command, designed specifically to facilitate forecasting applications that require regression analysis solutions. Regression models with an essentially unlimited number of independent/predictor variables are possible, although most useful regression models use only a handful of predictors.


Simultaneously forecasting a number of product items and their total

Given the following total sales for all dress shirts and the distribution of sales by color, what will individual and total sales be over the next six months?

Forecasting an item based on its relationship to other variables.

Monthly Dress Shirt Sales by Color

SmartForecasts’ unique Group Forecasting features automatically and simultaneously forecasts closely related time series, such as these items in the same product group. This saves considerable time and provides forecast results not only for the individual items but also for their total. “Eyeball” adjustments at both the item and group levels are easy to make. You can quickly create forecasts for product groups with hundreds or even thousands of items.


Forecasting thousands of items automatically

Given the following record of product demand at the SKU level, what can you expect demand to be over the next six months for each of the 5,000 SKUs?

Forecasting thousands of items automatically

Monthly Product Demand by SKU (Stock Keeping Unit)

In just a few minutes, SmartForecasts’ powerful Automatic Selection can take a forecasting job of this size, read the product demand data, automatically create statistical forecasts for each SKU, and saves the result. The results are then ready for export to your ERP system leveraging any one of our API-based connectors or via file export.  Once set up, forecasts will automatically be produced each planning cycle without intervention by the user.


Forecasting demand that is most often zero

A distinct and especially challenging type of data to forecast is intermittent demand, which is most often zero but jumps up to random nonzero values at random times. This pattern is typical of demand for slow moving items, such as service parts or big ticket capital goods.

For example, consider the following sample of demand for aircraft service parts. Note the preponderance of zero values with nonzero values mixed in, often in bursts.

Forecasting demand that is most often zero

SmartForecasts has a unique method designed especially for this type of data: the Intermittent Demand forecasting feature. Since intermittent demand arises most often in the context of inventory control, this feature focuses on forecasting the range of likely values for the total demand over a lead time, e.g., cumulative demand over the period Jun-23 to Aug-23 in the example above.


Forecasting inventory requirements

Forecasting inventory requirements is a specialized variant of forecasting that focuses on the high end of the range of possible future values.

For simplicity, consider the problem of forecasting inventory requirements for just one period ahead, say one day ahead. Usually, the forecasting job is to estimate the most likely or average level of product demand. However, if available inventory equals the average demand, there is about a 50% chance that demand will exceed inventory, resulting in lost sales and/or lost good will. Setting the inventory level at, say, ten times the average demand will probably eliminate the problem of stockouts, but will just as surely result in bloated inventory costs.

The trick of inventory optimization is to find a satisfactory balance between having enough inventory to meet most demand without tying up too many resources in the process. Usually, the solution is a blend of business judgment and statistics. The judgmental part is to define an acceptable inventory service level, such as meeting 95% of demand immediately from stock. The statistical part is to estimate the 95th percentile of demand.

When not dealing with intermittent demand, SmartForecasts estimates the required inventory level by assuming a bell-shaped (Normal) curve of demand, estimating both the middle and the width of the bell curve, then using a standard statistical formula to estimate the desired percentile. The difference between the desired inventory level and the average level of demand is called the safety stock because it protects against the possibility of stockouts.

When dealing with intermittent demand, the bell-shaped curve is a poor approximation to the statistical distribution of demand. In this special case, SmartForecasts uses patented intermittent demand forecasting technology to estimate the required inventory service level.


A Beginner’s Guide to Downtime and What to Do about It

This blog provides an overview of this topic written for non-experts. It

  • explains why you might want to read this blog.
  • lists the various types of “machine maintenance.”
  • explains what “probabilistic modeling” is.
  • describes models for predicting downtime.
  • explains what these models can do for you.

Importance of Downtime

If you manufacture things for sale, you need machines to make those things. If your machines are up and running, you have a fighting chance to make money. If your machines are down, you lose opportunities to make money. Since downtime is so fundamental, it is worth some investment of money and thought to minimize downtime. By thought I mean probability math, since machine downtime is inherently a random phenomenon. Probability models can guide maintenance policies.

Machine Maintenance Policies

Maintenance is your defense against downtime. There are multiple types of maintenance policies, ranging from “Do nothing and wait for failure” to sophisticated analytic approaches involving sensors and probability models of failure.

A useful list of maintenance policies is:

  • Sitting back and wait for trouble, then sitting around some more wondering what to do when trouble inevitably happens. This is as foolish as it sounds.
  • Same as above except you prepare for the failure to minimize downtime, e.g., stockpiling spare parts.
  • Periodically checking for impending trouble coupled with interventions such as lubricating moving parts or replacing worn parts.
  • Basing the timing of maintenance on data about machine condition rather than relying on a fixed schedule; requires ongoing data collection and analysis. This is called condition-based maintenance.
  • Using data on machine condition more aggressively by converting it into predictions of failure time and suggestions for steps to take to delay failure. This is called predictive maintenance.

The last three types of maintenance rely on probability math to establish a maintenance schedule, or determine when data on machine condition call for intervention, or calculate when failure might occur and how best to postpone it.


Probability Models of Machine Failure

How long a machine will run before it fails is a random variable. So is the time it will spend down. Probability theory is the part of math that deals with random variables. Random variables are described by their probability distributions, e.g., what is the chance that the machine will run for 100 hours before it goes down? 200 hours? Or, equivalently, what is the chance that the machine is still working after 100 hours or 200 hours?

A sub-field called “reliability theory” answers this type of question and addresses related concepts like Mean Time Before Failure (MTBF), which is a shorthand summary of the information encoded in the probability distribution of time before failure.

Figures 1 shows data on the time before failure of air conditioning units. This type of plot depicts the cumulative probability distribution and shows the chance that a unit will have failed after some amount of time has elapsed. Figure 2 shows a reliability function, plotting the same type of information in an inverse format, i.e., depicting the chance that a unit is still functioning after some amount of time has elapsed.

In Figure 1, the blue tick marks next to the x-axis show the times at which individual air conditioners were observed to fail; this is the basic data. The black curve shows the cumulative proportion of units failed over time. The red curve is a mathematical approximation to the black curve – in this case an exponential distribution. The plots show that about 80 percent of the units will fail before 100 hours of operation.
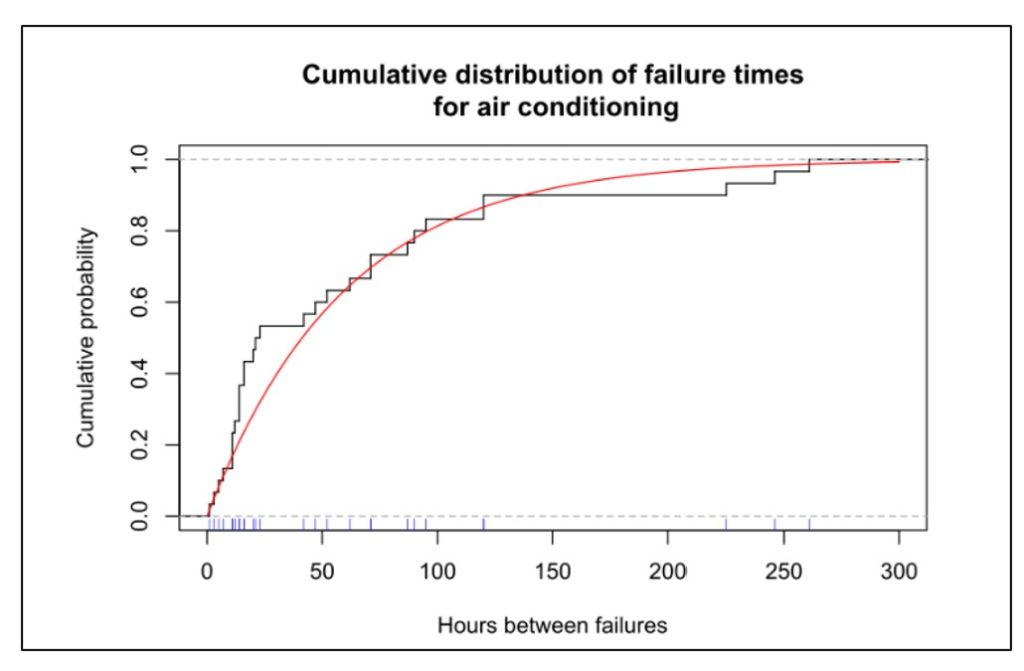
Figure 1 Cumulative distribution function of uptime for air conditioners

Figure 1 Cumulative distribution function of uptime for air conditioners


Probability models can be applied to an individual part or component or subsystem, to a collection of related parts (e.g., “the hydraulic system”), or to an entire machine. Any of these can be described by the probability distribution of the time before they fail.

Figure 2 shows the reliability function of six subsystems in a machine for digging tunnels. The plot shows that the most reliable subsystem is the cutting arms and the least reliable is the water subsystem. The reliability of the entire system could be approximated by multiplying all six curves (because for the system as a whole to work, every subsystem must be functioning), which would result in a very short interval before something goes wrong.
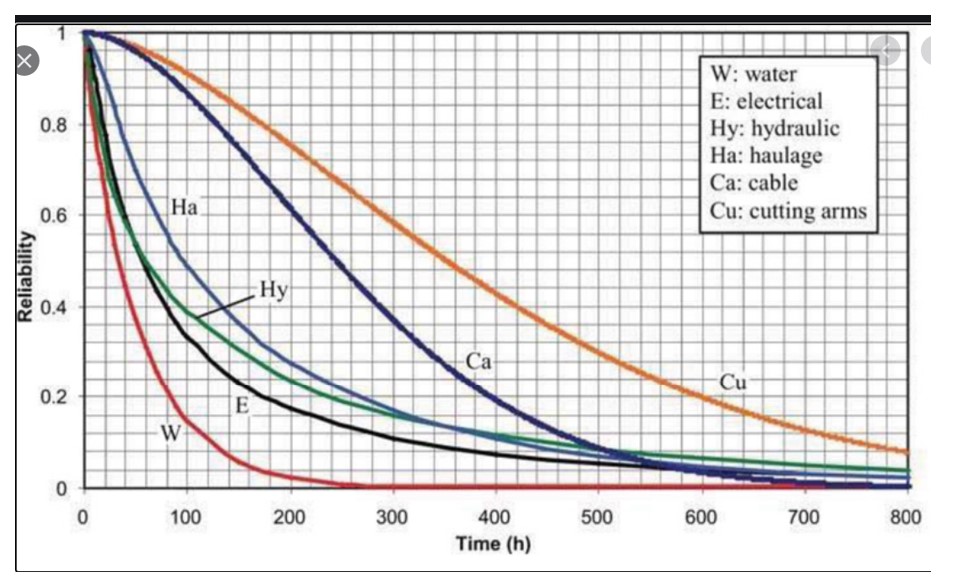
Figure 2 Examples of probability distributions of subsystems in a tunneling machine

Figure 2 Examples of probability distributions of subsystems in a tunneling machine


Various factors influence the distribution of the time before failure. Investing in better parts will prolong system life. So will investing in redundancy. So will replacing used pars with new.

Once a probability distribution is available, it can be used to answer any number of what-if questions, as illustrated below in the section on Benefits of Models.


Approaches to Modeling Machine Reliability

Probability models can describe either the most basic units, such as individual system components (Figure 2), or collections of basic units, such as entire machines (Figure 1). In fact, an entire machine can be modeled either as a single unit or as a collection of components. If treating an entire machine as a single unit, the probability distribution of lifetime represents a summary of the combined effect of the lifetime distributions of each component.

If we have a model of an entire machine, we can jump to models of collections of machines. If instead we start with models of the lifetimes of individual components, then we must somehow combine those individual models into an overall model of the entire machine.

This is where the math can get hairy. Modeling always requires a wise balance between simplification, so that some results are possible, and complication, so that whatever results emerge are realistic. The usual trick is to assume that failures of the individual pieces of the system occur independently.

If we can assume failures occur independently, it is usually possible to model collections of machines. For instance, suppose a production line has four machines churning out the same product. Having a reliability model for a single machine (as in Figure 1) lets us predict, for instance, the chance that only three of the machines will still be working one week from now. Even here there can be a complication: the chance that a machine working today will still be working tomorrow often depends on how long it has been since its last failure. If the time between failures has an exponential distribution like the one in Figure 1, then it turns out that the time of the next failure doesn’t depend on how long it has been since the last failure. Unfortunately, many or even most systems do not have exponential distributions of uptime, so the complication remains.

Even worse, if we start with models of many individual component reliabilities, working our way up to predicting failure times for the entire complex machine may be nearly impossible if we try to work with all the relevant equations directly. In such cases, the only practical way to get results is to use another style of modeling: Monte Carlo simulation.

Monte Carlo simulation is a way to substitute computation for analysis when it is possible to create random scenarios of system operation. Using simulation to extrapolate machine reliability from component reliabilities works as follows.

  1. Start with the cumulative distribution functions (Figure 1) or reliability functions (Figure 2) of each machine component.
  2. Create a random sample from each component lifetime to get a set of sample failure times consistent with its reliability function.
  3. Using the logic of how components are related to one another, compute the failure time of the entire machine.
  4. Repeat steps 1-3 many times to see the full range of possible machine lifetimes.
  5. Optionally, average the results of step 4 to summarize the machine lifetime with such metrics such as the MTBF or the chance that the machine will run more than 500 hours before failing.

Step 1 would be a bit complicated if we do not have a nice probability model for a component lifetime, e.g., something like the red line in Figure 1.

Step 2 can require some careful bookkeeping. As time moves forward in the simulation, some components will fail and be replaced while others will keep grinding on. Unless a component’s lifetime has an exponential distribution, its remaining lifetime will depend on how long the component has been in continual use. So this step must account for the phenomena of burn in or wear out.

Step 3 is different from the others in that it does require some background math, though of a simple type. If Machine A only works when both components 1 and 2 are working, then (assuming failure of one component does not influence failure of the other)

Probability [A works] = Probability [1 works] x Probability [2 works].

If instead Machine A works if either component 1 works or component 2 works or both work, then

Probability [A fails] = Probability [1 fails] x Probability [2 fails]

so Probability [A works] = 1 – Probability [A fails].

Step 4 can involve creation of thousands of scenarios to show the full range of random outcomes. Computation is fast and cheap.

Step 5 can vary depending on the user’s goals. Computing the MTBF is standard. Choose others to suit the problem. Besides the summary statistics provided by step 5, individual simulation runs can be plotted to build intuition about the random dynamics of machine uptime and downtime. Figure 3 shows an example for a single machine showing alternating cycles of uptime and downtime resulting in 85% uptime.
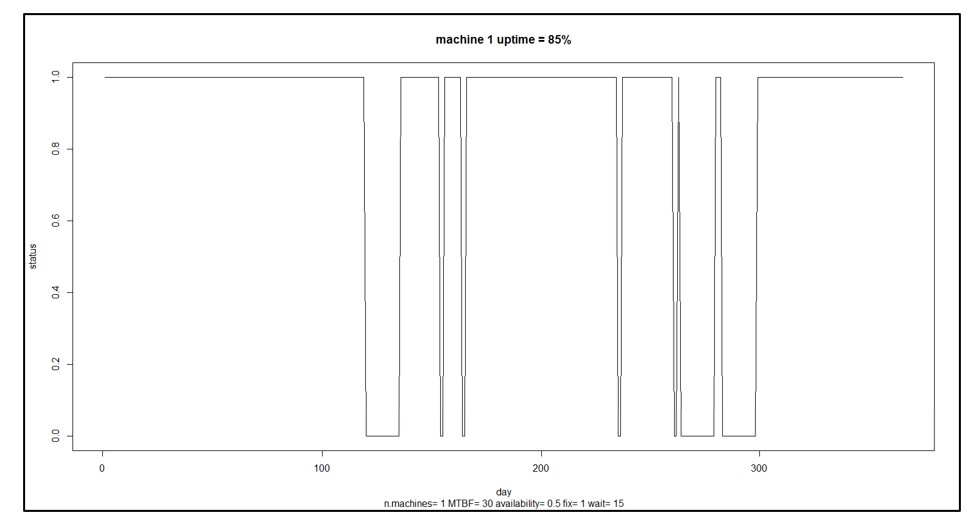
Figure 3 A sample scenario for a single machine

Figure 3 A sample scenario for a single machine


Benefits of Machine Reliability Models

In Figure 3, the machine is up and running 85% of the time. That may not be good enough. You may have some ideas about how to improve the machine’s reliability, e.g., maybe you can improve the reliability of component 3 by buying a newer, better version from a different supplier. How much would that help? That is hard to guess: component 3 may only one of several and perhaps not the weakest link, and how much the change pays off depends on how much better the new one would be. Maybe you should develop a specification for component 3 that you can then shop to potential suppliers, but how long does component 3 have to last to have a material impact on the machine’s MTBF?

This is where having a model pays off. Without a model, you’re relying on guesswork. With a model, you can turn speculation about what-if situations into accurate estimates. For instance, you could analyze how a 10% increase in MTBF for component 3 would translate into an improvement in MTBF for the entire machine.

As another example, suppose you have seven machines producing an important product. You calculate that you must dedicate six of the seven to fill a major order from your one big customer, leaving one machine to handle demand from a number of miscellaneous small customers and to serve as a spare. A reliability model for each machine could be used to estimate the probabilities of various contingencies: all seven machines work and life is good; six machines work so you can at least keep your key customer happy; only five machines work so you have to negotiate something with your key customer, etc.

In sum, probability models of machine or component failure can provide the basis for converting failure time data into smart business decisions.


Read more about  Maximize Machine Uptime with Probabilistic Modeling


Read more about   Probabilistic forecasting for intermittent demand


Leave a Comment
Related Posts
Why Inventory Planning Shouldn’t Rely Exclusively on Simple Rules of Thumb

Why Inventory Planning Shouldn’t Rely Exclusively on Simple Rules of Thumb

For too many companies, a critical piece of data fact-finding ― the measurement of demand uncertainty ― is handled by simple but inaccurate rules of thumb. For example, demand planners will often compute safety stock by a user-defined multiple of the forecast or historical average. Or they may configure their ERP to order more when on hand inventory gets to 2 x the average demand over the lead time for important items and 1.5 x for less important ones. This is a huge mistake with costly consequences.

Why MRO Businesses Should Care About Excess Inventory

Why MRO Businesses Should Care About Excess Inventory

Do MRO companies genuinely prioritize reducing excess spare parts inventory? From an organizational standpoint, our experience suggests not necessarily. Boardroom discussions typically revolve around expanding fleets, acquiring new customers, meeting service level agreements (SLAs), modernizing infrastructure, and maximizing uptime. In industries where assets supported by spare parts cost hundreds of millions or generate significant revenue (e.g., mining or oil & gas), the value of the inventory just doesn’t raise any eyebrows, and organizations tend to overlook massive amounts of excessive inventory.

Constructive Play with Digital Twins

Constructive Play with Digital Twins

Those of you who track hot topics will be familiar with the term “digital twin.” Those who have been too busy with work may want to read on and catch up. While there are several definitions of digital twin, here’s one that works well: A digital twin is a dynamic virtual copy of a physical asset, process, system, or environment that looks like and behaves identically to its real-world counterpart. A digital twin ingests data and replicates processes so you can predict possible performance outcomes and issues that the real-world product might undergo.

An Example of Simulation-Based Multiechelon Inventory Optimization

Managing the inventory in a single facility is difficult enough, but the problem becomes much more complex when there are multiple facilities arrayed in multiple echelons. The complexity arises from the interactions among the echelons, with demands at the lower levels bubbling up and any shortages at the higher levels cascading down.

If each of the facilities were to be managed in isolation, standard methods could be used, without regard to interactions, to set inventory control parameters such as reorder points and order quantities. However, ignoring the interactions between levels can lead to catastrophic failures. Experience and trial and error allow the design of stable systems, but that stability can be shattered by changes in demand patterns or lead times or by the addition of new facilities. Coping with such changes is greatly aided by advanced supply chain analytics, which provide a safe “sandbox” within which to test out proposed system changes before deploying them. This blog illustrates that point.


The Scenario

To have some hope of discussing this problem usefully, this blog will simplify the problem by considering the two-level hierarchy pictured in Figure 1. Imagine the facilities at the lower level to be warehouses (WHs) from which customer demands are meant to be satisfied, and that the inventory items at each WH are service parts sold to a wide range of external customers.


Fact and Fantasy in Multiechelon Inventory Optimization

Figure 1: General structure of one type of two-level inventory system

Imagine the higher level to consist of a single distribution center (DC) which does not service customers directly but does replenish the WHs. For simplicity, assume the DC itself is replenished from a Source that always has (or makes) sufficient stock to immediately ship parts to the DC, though with some delay. (Alternatively, we could consider the system to have retail stores supplied by one warehouse).

Each level can be described in terms of demand levels (treated as random), lead times (random), inventory control parameters (here, Min and Max values) and shortage policy (here, backorders allowed).


The Method of Analysis

The academic literature has made progress on this problem, though usually at the cost of simplifications necessary to facilitate a purely mathematical solution. Our approach here is more accessible and flexible: Monte Carlo simulation. That is, we build a computer program that incorporates the logic of the system operation. The program “creates” random demand at the WH level, processes the demand according to the logic of a chosen inventory policy, and creates demand for the DC by pooling the random requests for replenishment made by the WHs. This approach lets us observe many simulated days of system operation while watching for significant events like stockouts at either level.


An Example

To illustrate an analysis, we simulated a system consisting of four WHs and one DC. Average demand varied across the WHs. Replenishment from the DC to any WH took from 4 to 7 days, averaging 5.15 days. Replenishment of the DC from the Source took either 7, 14, 21 or 28 days, but 90% of the time it was either 21 or 28 days, making the average 21 days. Each facility had Min and Max values set by analyst judgement after some rough calculations.

Figure 2 shows the results of one year of simulated daily operation of this system. The first row in the figure shows the daily demand for the item at each WH, which was assumed to be “purely random”, meaning it had a Poisson distribution. The second row shows the on-hand inventory at the end of each day, with Min and Max values indicated by blue lines. The third row describes operations at the DC.  Contrary to the assumption of much theory, the demand into the DC was not close to being Poisson, nor was the demand out of the DC to the Source. In this scenario, Min and Max values were sufficient to keep item availability was high at each WH and at the DC, with no stockouts observed at any of the five facilities.


Click here to enlarge the image

Figure 2 - Simulated year of operation of a system with four WHs and one DC.

Figure 2 – Simulated year of operation of a system with four WHs and one DC.


Now let’s vary the scenario. When stockouts are extremely rare, as in Figure 2, there is often excess inventory in the system. Suppose somebody suggests that the inventory level at the DC looks a bit fat and thinks it would be good idea to save money there. Their suggestion for reducing the stock at the DC is to reduce the value of the Min at the DC from 100 to 50. What happens? You could guess, or you could simulate.

Figure 3 shows the simulation – the result is not pretty. The system runs fine for much of the year, then the DC runs out of stock and cannot catch up despite sending successively larger replenishment orders to the Source. Three of the four WHs descend into death spirals by the end of the year (and WH1 follows thereafter). The simulation has highlighted a sensitivity that cannot be ignored and has flagged a bad decision.


Click here to enlarge image

Figure 3 - Simulated effects of reducing the Min at the DC.

Figure 3 – Simulated effects of reducing the Min at the DC.


Now the inventory managers can go back to the drawing board and test out other possible ways to reduce the investment in inventory at the DC level. One move that always helps, if you and your supplier can jointly make it happen, is to create a more agile system by reducing replenishment lead time. Working with the Source to insure that the DC always gets its replenishments in either 7 or 14 days stabilizes the system, as shown in Figure 4.


Click here to enlarge image

Figure 4 - Simulated effects of reducing the lead time for replenishing the DC.

Figure 4 – Simulated effects of reducing the lead time for replenishing the DC.


Unfortunately, the intent of reducing the inventory at the DC has not been achieved. The original daily inventory count was about 80 units and remains about 80 units after reducing the DC’s Min and drastically improving the Source-to-DC lead time. But with the simulation model, the planning team can try out other ideas until they arrive at a satisfactory redesign. Or, given that Figure 4 shows the DC inventory starting to flirt with zero, they might think it prudent to accept the need for an average of about 80 units at the DC and look for ways to trim inventory investment at the WHs instead.


The Takeaways

  1. Multiechelon inventory optimization (MEIO) is complex. Many factors interact to produce system behaviors that can be surprising in even simple two-level systems.
  2. Monte Carlo simulation is a useful tool for planners who need to design new systems or tweak existing systems.


Leave a Comment
Related Posts
Why Inventory Planning Shouldn’t Rely Exclusively on Simple Rules of Thumb

Why Inventory Planning Shouldn’t Rely Exclusively on Simple Rules of Thumb

For too many companies, a critical piece of data fact-finding ― the measurement of demand uncertainty ― is handled by simple but inaccurate rules of thumb. For example, demand planners will often compute safety stock by a user-defined multiple of the forecast or historical average. Or they may configure their ERP to order more when on hand inventory gets to 2 x the average demand over the lead time for important items and 1.5 x for less important ones. This is a huge mistake with costly consequences.

Why MRO Businesses Should Care About Excess Inventory

Why MRO Businesses Should Care About Excess Inventory

Do MRO companies genuinely prioritize reducing excess spare parts inventory? From an organizational standpoint, our experience suggests not necessarily. Boardroom discussions typically revolve around expanding fleets, acquiring new customers, meeting service level agreements (SLAs), modernizing infrastructure, and maximizing uptime. In industries where assets supported by spare parts cost hundreds of millions or generate significant revenue (e.g., mining or oil & gas), the value of the inventory just doesn’t raise any eyebrows, and organizations tend to overlook massive amounts of excessive inventory.

Constructive Play with Digital Twins

Constructive Play with Digital Twins

Those of you who track hot topics will be familiar with the term “digital twin.” Those who have been too busy with work may want to read on and catch up. While there are several definitions of digital twin, here’s one that works well: A digital twin is a dynamic virtual copy of a physical asset, process, system, or environment that looks like and behaves identically to its real-world counterpart. A digital twin ingests data and replicates processes so you can predict possible performance outcomes and issues that the real-world product might undergo.