You Need to Team up with the Algorithms

Over forty years ago, Smart Software consisted of three friends working to start a company in a church basement. Today, our team has expanded to operate from multiple locations across Massachusetts, New Hampshire and Texas, with team members in England, Spain, Armenia and India. Like many of you in your jobs,  we have found ways to make distributed teams work for us and for you.

This note is about a different kind of teamwork: the collaboration between you and our software that happens at your fingertips. I often write about the software itself and what goes on “under the hood”. This time, my subject is how you should best team up with the software.

Our software suite, Smart Inventory Planning and Optimization (Smart IP&O™) is capable of massively detailed calculations of future demand and the inventory control parameters (e.g., reorder points and order quantities) that would most effectively manage that demand. But your input is required to make the most of all that power. You need to team up with the algorithms.

That interaction can take several forms. You can start by simply assessing how you are doing now. The report writing functions in Smart IP&O (Smart Operational Analytics™) can collate and analyze all your transactional data to measure your Key Performance Indicators (KPIs), both financial (e.g., inventory investment) and operational (e.g., fill rates).

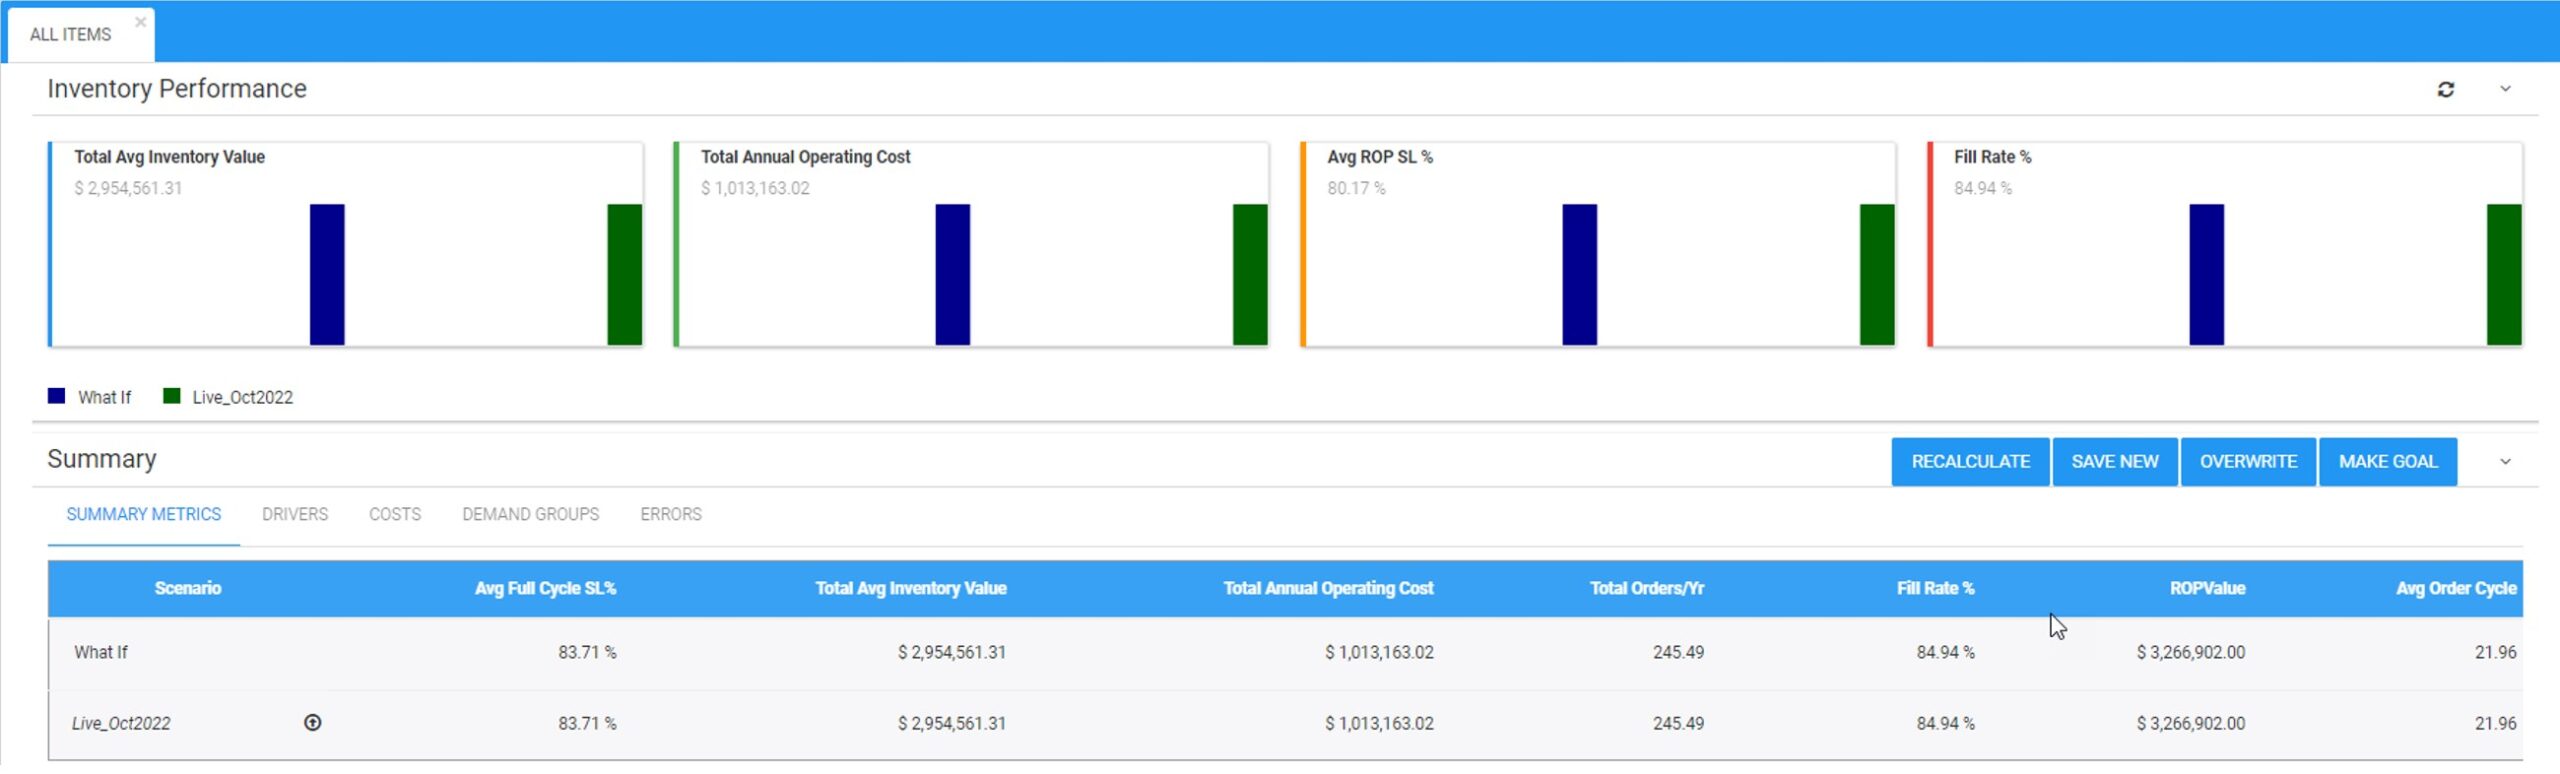
The next step might be to use SIO (Smart Inventory Optimization™), the inventory analytics within SIP&O, to play “what-if” games with the software. For example, you might ask “What if we reduced the order quantity on item 1234 from 50 to 40?” The software grinds the numbers to let you know how that would play out, then you react. This can be useful, but what if you have 50,000 items to consider? You would want to do what-if games for a few critical items, but not all of them.

The real power comes with using the automatic optimization capability in SIO. Here you can team with the algorithms at scale. Using your business judgement, you can create “groups”, i.e., collections of items that share some critical features. For example, you might create a group for “critical spare parts for electric utility customers” consisting of 1,200 parts. Then again calling on your business judgement, you could specify what item availability standard should apply to all the items in that group (e.g., “at least 95% chance of not stocking out in a year”). Now the software can take over and automatically work out the best reorder points and order quantities for every one of those items to achieve your required item availability at the lowest possible total cost. And that, dear reader, is powerful teamwork.


Rethinking forecast accuracy: A shift from accuracy to error metrics

Measuring the accuracy of forecasts is an undeniably important part of the demand planning process. This forecasting scorecard could be built based on one of two contrasting viewpoints for computing metrics. The error viewpoint asks, “how far was the forecast from the actual?” The accuracy viewpoint asks, “how close was the forecast to the actual?” Both are valid, but error metrics provide more information.

Accuracy is represented as a percentage between zero and 100, while error percentages start at zero but have no upper limit. Reports of MAPE (mean absolute percent error) or other error metrics can be titled “forecast accuracy” reports, which blurs the distinction.  So, you may want to know how to convert from the error viewpoint to the accuracy viewpoint that your company espouses.  This blog describes how with some examples.

Accuracy metrics are computed such that when the actual equals the forecast then the accuracy is 100% and when the forecast is either double or half of the actual, then accuracy is 0%. Reports that compare the forecast to the actual often include the following:

  • The Actual
  • The Forecast
  • Unit Error = Forecast – Actual
  • Absolute Error = Absolute Value of Unit Error
  • Absolute % Error = Abs Error / Actual, as a %
  • Accuracy % = 100% – Absolute % Error

Look at a couple examples that illustrate the difference in the approaches. Say the Actual = 8 and the forecast is 10.

Unit Error is 10 – 8 = 2

Absolute % Error = 2 / 8, as a % = 0.25 * 100 = 25%

Accuracy = 100% – 25% = 75%.

Now let’s say the actual is 8 and the forecast is 24.

Unit Error is 24– 8 = 16

Absolute % Error = 16 / 8 as a % = 2 * 100 = 200%

Accuracy = 100% – 200% = negative is set to 0%.

In the first example, accuracy measurements provide the same information as error measurements since the forecast and actual are already relatively close. But when the error is more than double the actual, accuracy measurements bottom out at zero. It does correctly indicate the forecast was not at all accurate. But the second example is more accurate than a third, where the actual is 8 and the forecast is 200. That’s a distinction a 0 to 100% range of accuracy doesn’t register. In this final example:

Unit Error is 200 – 8 = 192

Absolute % Error = 192 / 8, as a % = 24 * 100 = 2,400%

Accuracy = 100% – 2,400% = negative is set to 0%.

Error metrics continue to provide information on how far the forecast is from the actual and arguably better represent forecast accuracy.

We encourage adopting the error viewpoint. You simply hope for a small error percentage to indicate the forecast was not far from the actual, instead of hoping for a large accuracy percentage to indicate the forecast was close to the actual.  This shift in mindset offers the same insights while eliminating distortions.


Using Key Performance Predictions to Plan Stocking Policies

I can’t imagine being an inventory planner in spare parts, distribution, or manufacturing and having to create safety stock levels, reorder points, and order suggestions without using key performance predictions of service levels, fill rates, and inventory costs:

Using Key Performance Predictions to Plan Stocking Policies Iventory

Smart’s Inventory Optimization solution generates out-of-the-box key performance predictions that dynamically simulate how your current stocking policies will perform against possible future demands.  It reports on how often you’ll stock out, the size of the stockouts, the value of your inventory, holding costs, and more.  It lets you proactively identify problems before they occur so you can take corrective action in the short term. You can create what-if scenarios by setting targeted service levels and modifying lead times so you an see the predicted impact of these changes before committing to it.

For example,

  • You can see if a proposed move from the current service level of 90% to a targeted service level of 97% is financially advantageous
  • You can automatically identify if a different service level target is even more profitable to your business that the proposed target.
  • You can see exactly how much you’ll need to increase your reorder points to accommodate a longer lead time.


If you aren’t equipping planners with the right tools, they’ll be forced to set stocking policies, safety stock levels, and create demand forecasts in Excel or with outdated ERP functionality.   Not knowing how policies are predicted to perform will leave your company ill equipped to properly allocate inventory.  Contact us today to learn how we can help!


Every Forecasting Model is Good for What it is Designed for

​When you should use traditional extrapolative forecasting techniques.

With so much hype around new Machine Learning (ML) and probabilistic forecasting methods, the traditional “extrapolative” or “time series” statistical forecasting methods seem to be getting the cold shoulder.  However, it is worth remembering that these traditional techniques (such as single and double exponential smoothing, linear and simple moving averaging, and Winters models for seasonal items) often work quite well for higher volume data. Every method is good for what it was designed to do.  Just apply each appropriately, as in don’t bring a knife to a gunfight and don’t use a jackhammer when a simple hand hammer will do. 

Extrapolative methods perform well when demand has high volume and is not too granular (i.e., demand is bucketed monthly or quarterly). They are also very fast and do not use as many computing resources as probabilistic and ML methods. This makes them very accessible.

Are the traditional methods as accurate as newer forecasting methods?  Smart has found that extrapolative methods do very poorly when demand is intermittent. However, when demand is higher volume, they only do slightly worse than our new probabilistic methods when demand is bucketed monthly.  Given their accessibility, speed, and the fact you are going to apply forecast overrides based on business knowledge, the baseline accuracy difference here will not be material.

The advantage of more advanced models like Smart’s GEN2 probabilistic methods is when you need to predict patterns using more granular buckets like daily (or even weekly) data.  This is because probabilistic models can simulate day of the week, week of the month, and month of the year patterns that are going to be lost with simpler techniques.  Have you ever tried to predict daily seasonality with a Winter’s model? Here is a hint: It’s not going to work and requires lots of engineering.

Probabilistic methods also provide value beyond the baseline forecast because they generate scenarios to use in stress-testing inventory control models. This makes them more appropriate for assessing, say, how a change in reorder point will impact stockout probabilities, fill rates, and other KPIs. By simulating thousands of possible demands over many lead times (which are themselves presented in scenario form), you’ll have a much better idea of how your current and proposed stocking policies will perform. You can make better decisions on where to make targeted stock increases and decreases.

So, don’t throw out the old for the new just yet. Just know when you need a hammer and when you need a jackhammer.


Smart Software has been honored with the Epicor ISV Marketing Excellence Award

Belmont, MA, October 2023 – Smart Software is pleased to announce that it is the recipient of the Epicor ISV Marketing Excellence Award, recognizing Smart’s outstanding performance and contributions in driving successful marketing initiatives, campaigns, and innovation.

Pete Reynolds, Smart Software’s Vice President of Channel Sales, will receive the Marketing Excellence Award during the ISV Partner Briefing at Ignite. The event will take place in Dallas on Monday, October 23, 2023, from 10:45 am – 12:30 pm at the Gaylord Texan Convention Center.

Greg Hartunian, Smart Software’s CEO stated, “This recognition is a testament to the collaboration between the Smart and Epicor teams. Together, we’ve raised a great deal of awareness about the benefits of better inventory planning and forecasting.  We look forward to helping more customers in the year to come and launching our partnership to new heights.”

Smart Software is an Epicor Platinum Partner, the highest designation in the ISV Partner Program.


About Smart Software, Inc.

Founded in 1981, Smart Software, Inc. is a leader in providing businesses with enterprise-wide demand forecasting, planning, and inventory optimization solutions.  Smart Software’s demand forecasting and inventory optimization solutions have helped thousands of users worldwide, including customers such as Disney, Arizona Public Service, Ameren, and The American Red Cross.  Smart’s Inventory Planning & Optimization Platform, Smart IP&O, provides demand planners the tools to handle sales seasonality, promotions, new and aging products, multi-dimensional hierarchies, and intermittently demanded service parts and capital goods items.  It also provides inventory managers with accurate estimates of the optimal inventory and safety stock required to meet future orders and achieve desired service levels.  Smart Software is headquartered in Belmont, Massachusetts, and our website is www.smartcorp.com.


For more information, please contact Smart Software, Inc., Four Hill Road, Belmont, MA 02478.
Phone: 1-800-SMART-99 (800-762-7899); FAX: 1-617-489-2748; E-mail: info@smartcorp.com