I’ll bet your maintenance and repair teams would be ok with incurring higher stock out risks one some spare parts if they knew that the inventory reduction savings would be used to spread out the inventory investment more effectively to other parts and boost overall service levels.
I’ll double down that your Finance team, despite always being challenged with lowering costs, would support a healthy inventory increase if they could clearly see that the revenue benefits from increased uptime, fewer expedites, and service level improvements clearly outweighed the additional inventory costs and risk.
A spare parts tradeoff curve will enable service parts planning teams to properly communicate the risks and costs of each inventory decision. It is mission critical for parts planning and the only way to adjust stocking parameters proactively and accurately for each part. Without it, planners, for all intents and purposes, are “planning” with blinders on because they won’t be able to communicate the true tradeoffs associated with stocking decisions.
For example, if a proposed increase to the min/max levels of an important commodity group of service parts is recommended, how do you know whether the increase is too high or too low or just right? How can you fine-tune the change for thousands of spares? You won’t and you can’t. Your inventory decision making will rely on reactive, gut feel, and broad-brush decisions causing service levels to suffer and inventory costs to balloon.
So, what exactly is a spare parts tradeoff curve anyway?
It’s a fact-based, numerically driven prediction that details how changes in stocking levels will influence inventory value, holding costs, and service levels. For each unit change in inventory level there is a cost and a benefit. The spare parts tradeoff curve identifies these costs and benefits across different stocking levels. It lets planners discover the stock level that best balances the costs and benefits for each individual item.
Here are two simplified examples. In Figure 1, the spare parts tradeoff curve shows how the service level (probability of not stocking out) changes depending on the reorder level. The higher the reorder level, the lower the stockout risk. It is critical to know how much service you are gaining given the inventory investment. Here you may be able to justify that an inventory increase from a reorder point of 35 to 45 is well worth the investment of 10 additional units of stock because service levels jumps from just under 70% to 90%, cutting your stockout risk for the spare part from 30% to 10%!

Figure 1: Cost versus Service Level
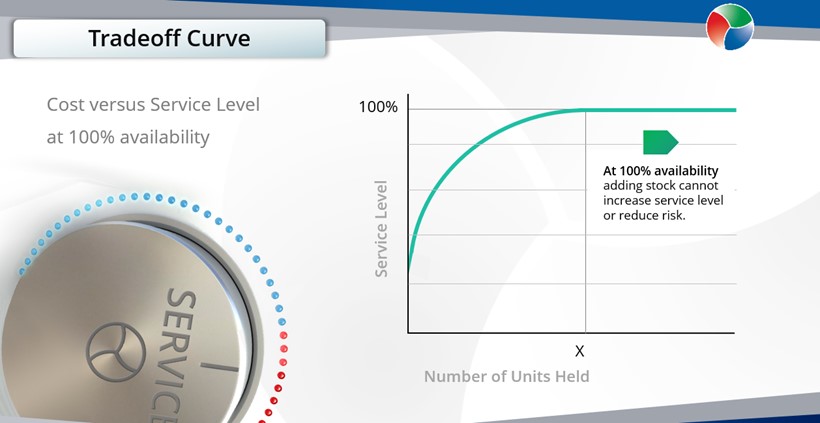
Figure 2: Service Level versus Size of Inventory
In this example (Figure 2), the tradeoff curve exposes a common problem with spare parts inventory. Often stock levels are so high that they generate negative returns. After a certain stocking quantity, each additional unit of stock does not buy more benefit in the form of a higher service level. Inventory decreases can be justified when it is clear the stock level is well past the point of diminishing returns. An accurate tradeoff curve will expose the point where it is no longer advantageous to add stock.
By leveraging #probabilisticforecasting to drive parts planning, you can communicate these tradeoffs accurately, do so at scale across hundreds of thousands of parts, avoid bad inventory decisions, and balance service levels and costs. At Smart Software, we specialize in helping spare parts planners, Directors of Materials Management, and financial executives managing MRO, spare parts, and aftermarket parts to understand and exploit these relationships.
Spare Parts Planning Software solutions
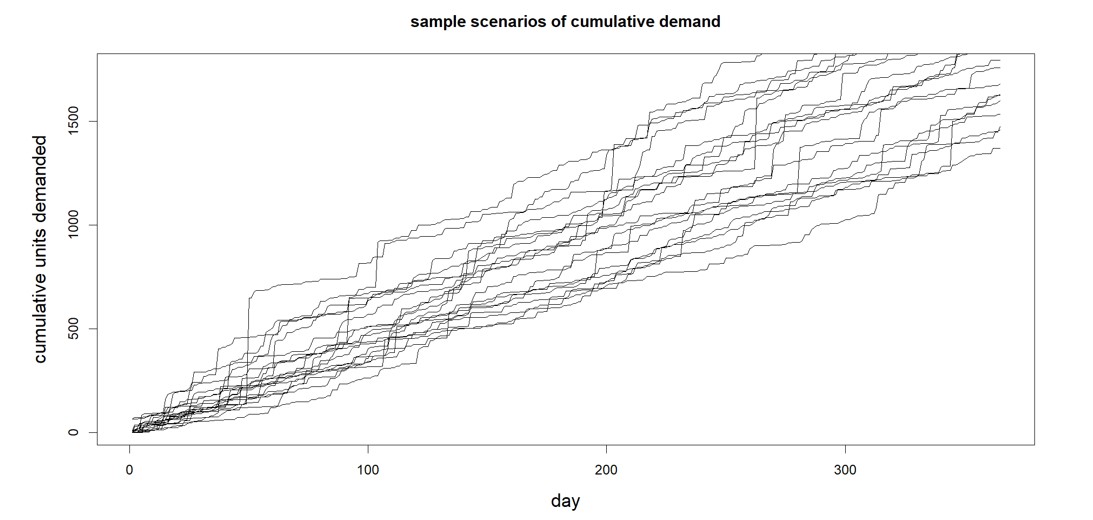
Smart IP&O’s service parts forecasting software uses a unique empirical probabilistic forecasting approach that is engineered for intermittent demand. For consumable spare parts, our patented and APICS award winning method rapidly generates tens of thousands of demand scenarios without relying on the assumptions about the nature of demand distributions implicit in traditional forecasting methods. The result is highly accurate estimates of safety stock, reorder points, and service levels, which leads to higher service levels and lower inventory costs. For repairable spare parts, Smart’s Repair and Return Module accurately simulates the processes of part breakdown and repair. It predicts downtime, service levels, and inventory costs associated with the current rotating spare parts pool. Planners will know how many spares to stock to achieve short- and long-term service level requirements and, in operational settings, whether to wait for repairs to be completed and returned to service or to purchase additional service spares from suppliers, avoiding unnecessary buying and equipment downtime.
Contact us to learn more how this functionality has helped our customers in the MRO, Field Service, Utility, Mining, and Public Transportation sectors to optimize their inventory. You can also download the Whitepaper here.
White Paper: What you Need to know about Forecasting and Planning Service Parts
This paper describes Smart Software’s patented methodology for forecasting demand, safety stocks, and reorder points on items such as service parts and components with intermittent demand, and provides several examples of customer success.