Warning Signs that You Have a Supply Chain Analytics Gap

“Business is war” may be an overdone metaphor but it’s not without validity. Like the “Bomber Gap” and the “Missile Gap,” worries about falling behind the competition, and the resulting threat of annihilation, always lurk in the minds of business executives, If they don’t, they should, because not all gaps are imaginary (the Bomber Gap and the Missile Gap were shown to not exist between the US and the USSR, but the 1980’s gap between Japanese and American productivity was all too real). The difference between paranoia and justified concern is converting fear into facts. This post is about organizing your attention toward possible gaps in your company’s supply chain analytics.

Surveillance Gaps

The US Army has a saying: “Time spent on reconnaissance is never wasted.” Now and then, our Smart Forecaster blog has a post that helps you get your head on a swivel to see what’s going on around you. An example is our post on digital twins, which is a hot topic throughout the engineering world.  To recap: using demand and supply simulations to probe for weaknesses in your inventory plan is a form of supply chain reconnaissance.  Closing this surveillance gap enables businesses to take corrective action before an actual problem emerges.

Situational Awareness Gaps

A military commander needs to keep track of what is available for use and how well it is being used. The reports available in Smart Operational Analytics keep you current on your inventory counts, your forecasting accuracy, your suppliers’ responsiveness, and trends in these and other operational areas.  You’ll know exactly where you stand on a variety of supply chain KPIs such as service level, fill rates, and inventory turns.  You’ll know whether actual performance is aligned with planned performance and whether the inventory plan (i.e., what to order, when, from whom, and why) is being adhered to or ignored.

Agility Gaps

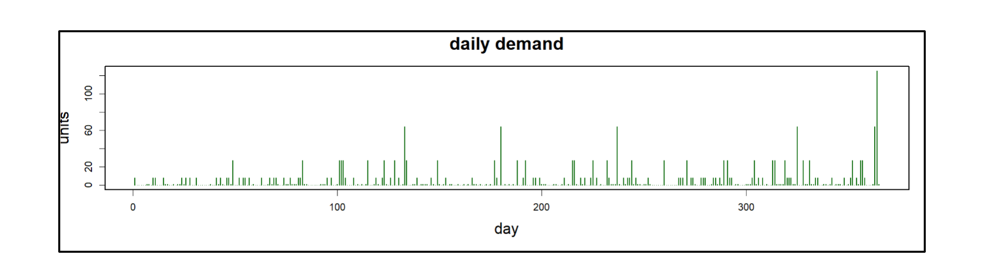
The business environment can change rapidly. All it takes is a tanker stuck sideways in the Suez Canal, a few anti-ship ballistic missiles in the Red Sea, or a region-wide weather event. These catastrophes may fall as much on your competitors’ heads as on yours, but which of you is agile enough to react first? Exception reporting in Demand Planner and Smart Operational Analytics can detect major changes in the character of demand so you can quickly filter out obsolete demand data before they poison all your calculations for demand forecasts or inventory optimization. Smart Demand Planner can give advance warning of a pending increase or decrease in demand. Smart Inventory Optimization can help you adjust your inventory replenishment tactics to reflect these shifts in demand.


Innovation Gaps

Whether you refer to your competition as “The Other Guys” or “Everybody Else” or something unprintable, the ones you have to worry about are the ones always looking for an edge. When you choose Smart as your partner, we’ll give you that edge with innovative but field proven predictive solutions.  Smart Software has been innovating predictive modeling since birth over 40 years ago.

  • Our first products introduced multiple technical innovations: assessment of forecast quality by looking into the future not the past; automatic selection of the best among a set of competing methodologies, exploiting the graphics in the first PCs to allow easy management overrides of statistical forecasts.
  • Later we invented and patented a radically different approach to forecasting the intermittent demand that is characteristic of both spare parts and big-ticket durable goods. Our technology was patented, received multiple awards for dramatically improving the management of inventory.  The solution is now a field proven approach used by many leading businesses in service parts, MRO, aftermarket parts, and field service.
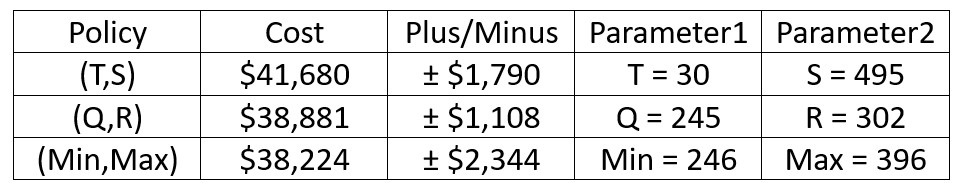
  • More recently, Smart’s cloud platform for demand forecasting, predictive modeling, inventory optimization, and analytics, takes all relevant data otherwise locked in your ERP or EAM systems, external files, and other disparate data sources, organizes it in the Smart Data Pipeline, structures it into our common data model, and processes it in our AWS cloud.  Smart uses the power of our patented probabilistic demand simulations in Smart Inventory Optimization to stress test and optimize the rules you use to manage each of your inventory items.

It’s my job, along with my cofounder Dr. Nelson Hartunian, our data science team, and academic consultants, to continue to push the envelope of supply chain analytics and bring the benefits back to you by continuously rolling out new versions of our products so you don’t get stuck in an innovation gap – or any of the others.


5 Steps to Improve the Financial Impact of Spare Parts Planning

In today’s competitive business landscape, companies are constantly seeking ways to improve their operational efficiency and drive increased revenue. Optimizing service parts management is an often-overlooked aspect that can have a significant financial impact. Companies can improve overall efficiency and generate significant financial returns by effectively managing spare parts inventory. This article will explore the economic implications of optimized service parts management and how investing in Inventory Optimization and Demand Planning Software can provide a competitive advantage.

The Importance of Optimized Service Parts Planning:

Optimized service parts management plays a vital role in mitigating inventory risks and ensuring critical spare parts availability. While subjective planning may work on a small scale, it becomes insufficient when managing large inventories of intermittently demanded spare parts. Traditional forecasting approaches simply fail to accurately account for the extreme demand variability and frequent periods of zero demand that is so common with spare parts.  This results in large misallocations of stock, higher costs, and poor service levels.

The key to optimized service parts management lies in understanding the trade-off between service and cost. Inventory Optimization and Demand Planning Software powered by probabilistic forecasting and Machine learning Algorithms can help companies better understand the cost vs. benefit of each inventory decision and wield inventory as a competitive asset. By generating accurate demand forecasts and optimal stocking policies such as Min/Max, Safety Stock Levels, and Reorder Points in seconds, companies can know how much is too much and when to add more. By wielding inventory as a competitive asset, companies can drive up service levels and drive down costs.

Improve the Financial Outcome of Spare Parts Planning

  1. Accurate forecasting is crucial to optimize inventory planning and meet customer demand effectively. State-of-the-art demand planning software accurately predicts inventory requirements, even for intermittent demand patterns. By automating forecasting, companies can save time, money, and resources while improving accuracy.
  2. Meeting customer demand is a critical aspect of service parts management. Companies can enhance customer satisfaction, loyalty, and increase their chances of winning future contracts for the asset-intensive equipment they sell by ensuring the availability of spare parts when needed. Through effective demand planning and inventory optimization, organizations can reduce lead times, minimize stockouts, and maintain service levels, thereby improving the financial impact of all decisions.
  3. Financial gains can be achieved through optimized service parts planning, including the reduction of inventory and product costs. Excess storage and obsolete inventory can be significant cost burdens for organizations. By implementing best-of-breed inventory optimization software, companies can identify cost-effective solutions, driving up service levels and reducing costs. This leads to improved inventory turnover, reduced carrying costs, and increased profitability.
  4. Procurement planning is another essential aspect of service parts management. Organizations can optimize inventory levels, reduce lead times, and avoid stockouts by aligning procurement and the associated order quantities with accurate demand forecasts. For example, accurate forecasts can be shared with suppliers so that blanket purchase commitments can be made. This provides the supplier revenue certainty and, in exchange, can hold more inventory, thereby reducing lead times.
  5. Intermittent demand planning is a particular challenge in spare parts management. Conventional rule-of-thumb approaches fall short in handling demand variability effectively. This is because traditional approaches assume demand is normally distributed when in reality, it is anything but normal. Spare parts demand random bursts of large demand intersperse many period of zero demand.  Smart Software’s solution incorporates advanced statistical models and machine learning algorithms to analyze historical demand patterns, enabling accurate planning for intermittent demand. Companies can significantly reduce stockout costs and improve efficiency by addressing this challenge.

Evidence from Smart Software’s Customers:

Investing in Smart Software’s Inventory Optimization and Demand Planning Software enables companies to unlock cost savings, elevate customer service levels, and enhance operational efficiency. Through accurate demand forecasting, optimized inventory management, and streamlined procurement processes, organizations can achieve financial savings, meet customer demands effectively, and improve overall business performance.

  • Metro-North Railroad (MNR) experienced an 8% reduction in parts inventory, reaching a record high customer service level of 98.7%, and reduced inventory growth for new equipment from a projected 10% to only 6%. Smart Software played a crucial role in identifying multi-year service part needs, reducing administrative lead times, formulating stock reduction plans for retiring fleets, and identifying inactive inventory for disposal. MNR saved costs, maximized disposal benefits, improved service levels, and gained accurate insights for informed decision-making, ultimately improving their bottom line and customer satisfaction.
  • Seneca Companies, an industry leader in automotive petroleum services, adopted Smart Software to model customer demand, control inventory performance, and drive replenishment. Field service technicians embraced its use, and total inventory investment decreased by more than 25%, from $11 million to $8 million, while maintaining first-time fix rates of 90%+.
  • A leading Electric Utility implemented Smart IP&O in just 3 months and then used the software to optimize its reorder points and order quantities for over 250,000 spare parts. During the first phase of the implementation, the platform helped the Utility reduce inventory by $9,000,000 while maintaining service levels. The implementation was part of the company’s strategic supply chain optimization initiative.

Optimizing Service Parts Planning for Competitive Advantage

Optimized service parts management is crucial for companies seeking to improve efficiency, reduce costs, and ensure the availability of necessary spare parts. Organizations can unlock significant value in this field by investing in Smart Software’s Inventory Optimization and Demand Planning Software. Companies can achieve better financial performance and gain a competitive edge in their respective markets through improved data analysis, automation, and inventory planning.

Smart Software is designed for the modern marketplace, which is volatile and always changing. It can handle SKU proliferation, longer supply chains, less predictable lead times, and more intermittent and less forecastable demand patterns. It can also integrate with virtually every ERP solution on the market, by field-proven seamless connections or using a simple import/export process supported by Smart Software’s data model and data processing engine. By using Smart Software, companies can leverage inventory as a competitive asset, enhance customer satisfaction, drive up service levels, push down costs, and save substantial money.


Spare Parts Planning Software solutions

Smart IP&O’s service parts forecasting software uses a unique empirical probabilistic forecasting approach that is engineered for intermittent demand. For consumable spare parts, our patented and APICS award winning method rapidly generates tens of thousands of demand scenarios without relying on the assumptions about the nature of demand distributions implicit in traditional forecasting methods. The result is highly accurate estimates of safety stock, reorder points, and service levels, which leads to higher service levels and lower inventory costs. For repairable spare parts, Smart’s Repair and Return Module accurately simulates the processes of part breakdown and repair. It predicts downtime, service levels, and inventory costs associated with the current rotating spare parts pool. Planners will know how many spares to stock to achieve short- and long-term service level requirements and, in operational settings, whether to wait for repairs to be completed and returned to service or to purchase additional service spares from suppliers, avoiding unnecessary buying and equipment downtime.

Contact us to learn more how this functionality has helped our customers in the MRO, Field Service, Utility, Mining, and Public Transportation sectors to optimize their inventory. You can also download the Whitepaper here.


White Paper: What you Need to know about Forecasting and Planning Service Parts


This paper describes Smart Software’s patented methodology for forecasting demand, safety stocks, and reorder points on items such as service parts and components with intermittent demand, and provides several examples of customer success.


    Head to Head: Which Service Parts Inventory Policy is Best?

    Our customers have usually settled into one way to manage their service parts inventory. The professor in me would like to think that the chosen inventory policy was a reasoned choice among considered alternatives, but more likely it just sort of happened. Maybe the inventory honcho from long ago had a favorite and that choice stuck. Maybe somebody used an EAM or ERP system that offered only one choice. Perhaps there were some guesses made, based on the conditions at the time.

    The Competitors

    Too seldom, businesses make these choices in haphazard ways. But modern service parts planning software lets you be more systematic about your choices. This post demonstrates that proposition by making objective comparisons among three popular inventory policies:  Order Up To, Reorder Point/Order Quantity, and Min/Max.  I discussed each of these policies in this video blog.

    • Order Up To. This is a periodic review policy where every T days, on-hand inventory is tallied and an order of random size is placed to bring the stock level back up to S units.
    • Q, R or Reorder Point/Order Quantity. Q, R is a continuous review policy where every day, inventory is tallied. If there are Q or fewer units on hand, an order of fixed size is placed for R more units.
    • Min, Max is another continuous review policy where every day, inventory is tallied. If there are Min or fewer units on hand, an order is placed to bring the stock level back up to Max units.

    Inventory theory says these choices are listed in increasing order of effectiveness. The first option, Order Up To, is clearly the simplest and cheapest to implement, but it closes its eyes to what’s going on for long periods of time.  Imposing a specified passage of time in between orders makes it, in theory, less flexible. In contrast, the two continuous review options keep an eye on what’s happening all the time, so they can react to potential stockouts quicker. The Min/Max option is, in theory, more flexible than the option that uses a fixed reorder quantity because the size of the order dynamically changes to accommodate the demand.

    That’s the theory. This post examines evidence from head-to-head comparisons to check the theory and put concrete numbers on the relative performance of the three policies.

    The Meaning of “Best”

    How should we keep score in this tournament? If you are a regular reader of this Smart Forecaster blog, you know that the core of inventory planning is a tug-of-war between two opposing objectives: keeping inventory lean vs keeping item availability metrics such as service level high.

    To simplify things, we will compute “one number to rule them all”: the average operating cost. The winning policy will be the one with the lowest average.

    This average is the sum of three components: the cost of holding inventory (“holding cost”), the cost of ordering replenishment units (“ordering cost”) and the cost of losing a sale (“shortage cost”). To make things concrete, we used the following assumptions:

    • Each service part is valued at $1,000.
    • Annual holding cost is 10% of item value, or $100 per year per unit.
    • Processing each replenishment order costs $20 per order.
    • Each unit demanded but not provided costs the value of the part, $1,000.

    For simplicity, we will refer to the average operating cost as simply “the cost”.

    Of course, the lowest average cost can be achieved by getting out of the business. So the competition required a performance constraint on item availability: Each option had to achieve a fill rate of at least 99%.

    The Alternatives Duke it Out

    A key element of context is whether stockouts result in losses or backorders. Assuming that the service part in question is critical, we assumed that unfilled orders are lost, which means that a competitor fills the order. In an MRO environment, this will mean additional downtime due to stockout.

    To compare the alternatives, we used our predictive modeling engine to run a large number of Monte Carlo simulations.  Each simulation involved specifying the parameter values of each policy (e.g., Min and Max values), generating a demand scenario, feeding that into the logic of the policy, and measuring the resulting cost averaged over 365 days of operation. Repeating this process 1,000 times and averaging the 1,000 resulting costs gave the final result for each policy.  

    To make the comparison fair, each alternative had to be designed for its best performance. So we searched the “design space” of each policy to find the design with the lowest cost. This required repeating the process described in the previous paragraph for many pairs of parameter values and identifying the pair yielding the lost average annual operating cost.

    Using the algorithms in Smart Inventory Optimization (SIOTM) we made head-to-head-to-head comparisons under the following assumptions about demand and supply:

    • Item demand was assumed to be intermittent and highly variable but relatively simple in that there was neither trend nor seasonality, as is often true for service parts. Daily mean demand was 5 units with a large standard deviation of 13 units. Figure 1 shows a sample of one year’s demand. We have chosen a very challenging demand pattern, in which some days have 10 to even 20 times the average demand.

    Daily part demand was assumed to be intermittent and very spikey.

    Figure 1: Daily part demand was assumed to be intermittent and very spikey.

    ​​

    • Suppliers’ replenishment lead times were 14 days 75% of the time and 21 days otherwise. This reflects the fact that there is always uncertainty in the supply chain.


    And the Winner Is…

    Was the theory right? Kinda’ sorta’.

    Table 1 shows the results of the simulation experiments. For each of the three competing policies, it shows the average annual operating cost, the margin of error (technically, an approximate 95% confidence interval for the mean cost), and the apparent best choices for parameter values.

    Results of the simulated comparisons

    Table 1: Results of the simulated comparisons

    For example, the average cost for the (T,S) policy when T is fixed at 30 days was $41,680. But the Plus/Minus implies that the results are compatible with a “true” cost (i.e., the estimate from an infinite number of simulations) of anywhere between $39,890 and $43,650. The reason there is so much statistical uncertainty is the extremely spikey nature of demand in this example.

    Table 1 says that, in this example, the three policies fall in line with expectations. However, more useful conclusions would be:

    1. The three policies are remarkably similar in average cost. By clever choice of parameter values, one can get good results out of any of the three policies.
    2. Not shown in Table 1, but clear from the detailed simulation results, is that poor choices for parameter values can be disastrous for any policy.
    3. It is worth noting that the periodic review (T,S) policy was not allowed to optimize over possible values of T. We fixed T at 30 to mimic what is common in practice, but those who use the periodic review policy should consider other review periods. An additional experiment fixed the review period at T = 7 days. The average cost in this scenario was minimized at $36,551 ± $1,668 with S = 343. This result is better than that using T = 30 days.
    4. We should be careful about over-generalizing these results. They depend on the assumed values of the three cost parameters (holding, ordering and shortage) and the character of the demand process.
    5. It is possible to run experiments like those shown here automatically in Smart Inventory Optimization. This means that you too would be able to explore design choices in a rigorous way.


    The Forecasting Process for Decision-Makers

    In almost every business and industry, decision-makers need reliable forecasts of critical variables, such as sales, revenues, product demand, inventory levels, market share, expenses, and industry trends.

    Many kinds of people make these forecasts. Some are sophisticated technical analysts, such as business economists and statisticians. Many others regard forecasting as an important part of their overall work: general managers, production planners, inventory control specialists, financial analysts, strategic planners, market researchers, and product and sales managers. Still, others seldom think of themselves as forecasters but often have to make forecasts on an intuitive, judgmental basis.

    Because of the way we designed Smart Demand Planner, it has something to offer all types of forecasters. This design grows out of several observations about the forecasting process. Because we designed Smart Demand Planner with these observations in mind, we believe it has a style and content uniquely suited for turning your browser into an effective forecasting and planning tool:

    Forecasting is an art that requires a mix of professional judgment and objective, statistical analysis.

    It is often effective to begin with an objective statistical forecast that automatically accounts for trends, seasonality, and other patterns.  Then, apply adjustments or forecast overrides based on your business judgment. Smart Demand Planner makes it easy to execute graphical and tabular adjustments to statistical forecasts.

    The forecasting process is usually iterative.

    You will likely decide to make several refinements of your initial forecast before you are satisfied. You may want to exclude older historical data that you find to no longer be relevant.  You could apply different weights to the forecast model that put varying emphases on the most recent data. You could apply trend dampening to increase or decrease aggressively trending statistical forecasts.  You could allow the Machine Learning models to fine-tune the forecast selection for you and select the winning model automatically.  Smart Demand Planner’s processing speed gives you plenty of time to make several passes and saves multiple versions of the forecasts as “snapshots” so you can compare forecast accuracy later.

    Forecasting requires graphical support.

    The patterns evident in data can be seen by a discerning eye. The credibility of your forecasts will often depend heavily on graphical comparisons other business stakeholders make when they assess the historical data and forecasts. Smart Demand Planner provides graphical displays of forecasts, history, and forecast vs. actuals reporting.

    Forecasts are never exactly correct.

    Because some error always creeps into even the best forecasting process, one of the most useful supplements to a forecast is an honest estimate of its margin of error.

    Smart Demand Planner presents both graphical and tabular summaries of forecast accuracy based on the acid test of predicting data held back from development of the forecasting model. 

    Forecast intervals or confidence intervals are also very useful.  They detail the likely range of possible demand that is expected to occur.  For example, if actual demand falls outside of the 90% confidence interval more than 10% of the time then there is reason to investigate further.  

    Forecasting requires a match of method to data.

    One of the major technical tasks in forecasting is to match the choice of forecasting technique to the nature of the data. Features of a data series like trend, seasonality or abrupt shifts in level suggest certain techniques instead of others.

    Smart Demand Planner’ Automatic forecasting feature makes this match quickly, accurately and automatically.

    Forecasting is often a part of a larger process of planning or control.

    For example, forecasting can be a powerful complement to spreadsheet-based financial analysis, extending rows of figures off into the future. In addition, accurate sales and product demand forecasts are fundamental inputs to a manufacturer’s production planning and inventory control processes. An objective statistical forecast of future sales will always help identify when the budget (or sales plan) may be too unrealistic. Gap analysis enables the business to take corrective action to their demand and marketing plans to ensure they do not miss the budgeted plan.

    Forecasts need to be integrated into ERP systems
    Smart Demand Planner can quickly and easily transfer its results to other applications, such as spreadsheets, databases and planning systems including ERP applications.  Users are able to export forecasts in a variety of file formats either via download or to secure FTP file locations.  Smart Demand Planner includes API based integrations to a variety of ERP and EAM systems including Epicor Kinetic and Epicor Prophet 21, Sage X3 and Sage 300, Oracle NetSuite, and each of Microsoft’s Dynamics 365 ERP systems. API based integrations enable customers to push forecast results directly back to the ERP system on demand.

    The result is more efficient sales planning, budgeting, production scheduling, ordering, and inventory planning.


    Leveraging ERP Planning BOMs with Smart IP&O to Forecast the Unforecastable

    ​In a highly configurable manufacturing environment, forecasting finished goods can become a complex and daunting task. The number of possible finished products will skyrocket when many components are interchangeable. A traditional MRP would force us to forecast every single finished product which can be unrealistic or even impossible. Several leading ERP solutions introduce the concept of the “Planning BOM”, which allows the use of forecasts at a higher level in the manufacturing process. In this article, we will discuss this functionality in ERP, and how you can take advantage of it with Smart Inventory Planning and Optimization (Smart IP&O) to get ahead of your demand in the face of this complexity.

    Why Would I Need a Planning BOM?

    Traditionally, each finished product or SKU would have a rigidly defined bill of materials. If we stock that product and want to plan around forecasted demand, we would forecast demand for those products and then feed MRP to blow this forecasted demand from the finished good level down to its components via the BOM.

    Many companies, however, offer highly configurable products where customers can select options on the product they are buying. As an example, recall the last time you bought a personal computer. You chose a brand and model, but from there, you were likely presented with options: what speed of CPU do you want? How much RAM do you want? What kind of hard drive and how much space? If that business wants to have these computers ready and available to ship to you in a reasonable time, suddenly they are no longer just anticipating demand for that model—they must forecast that model for every type of CPU, for all quantities of RAM, for all types of hard drive, and all possible combinations of those as well! For some manufacturers, these configurations can compound to hundreds or thousands of possible finished good permutations.

    Planning BOM emphasizing the large numbers of permutations Laptops Factory Components

    There may be so many possible customizations that the demand at the finished product level is completely unforecastable in a traditional sense. Thousands of those computers may sell every year, but for each possible configuration, the demand may be extremely low and sporadic—perhaps certain combinations sell once and never again.

    This often forces these companies to plan reorder points and safety stock levels mostly at the component level, while largely reacting to firm demand at the finished good level via MRP. While this is a valid approach, it lacks a systematic way to leverage forecasts that may account for anticipated future activity such as promotions, upcoming projects, or sales opportunities. Forecasting at the “configured” level is effectively impossible, and trying to weave in these forecast assumptions at the component level isn’t feasible either.


    Planning BOM Explained

    This is where Planning BOMs come in. Perhaps the sales team is working a big b2b opportunity for that model, or there’s a planned promotion for Cyber Monday. While trying to work in those assumptions for every possible configuration isn’t realistic, doing it at the model level is totally doable—and tremendously valuable.

    The Planning BOM can use a forecast at a higher level and then blow demand down based on predefined proportions for its possible components. For example, the computer manufacturer may know that most people opt for 16GB of RAM, and far fewer opt for the upgrades to 32 or 64. The planning BOM allows the organization to (for example) blow 60% of the demand down to the 16GB option, 30% to the 32GB option, and 10% to the 64GB option. They could do the same for CPUs, hard drives, or any other customizations available.  

    Planning BOM Explained with computer random access memory ram close hd


    The business can now focus their forecast at this model level, leaving the Planning BOM to figure out the component mix. Clearly, defining these proportions requires some thought, but Planning BOMs effectively allow businesses to forecast what would otherwise be unforecastable.


    The Importance of a Good Forecast

    Of course, we still need a good forecast to load into an ERP system. As explained in this article, while ERP  can import a forecast, it often cannot generate one and when it does it tends to require a great deal of hard to use configurations that don’t often get revisited resulting in inaccurate forecasts.  It is therefore up to the business to come up with their own sets of forecasts, often manually produced in Excel. Forecasting manually generally presents a number of challenges, including but not limited to:

    • The inability to identify demand patterns like seasonality or trend
    • Overreliance on customer or sales forecasts
    • Lack of accuracy or performance tracking

    No matter how well configured the MRP is with your carefully considered Planning BOMs, a poor forecast means poor MRP output and mistrust in the system—garbage in, garbage out. Continuing along with the “computer company” example, without a systematic way of capturing key demand patterns and/or domain knowledge in the forecast, MRP can never see it.


    Extend ERP  with Smart IP&O

    Smart IP&O is designed to extend your ERP system with a number of integrated demand planning and inventory optimization solutions. For example, it can generate statistical forecasts automatically for large numbers of items, allows for intuitive forecast adjustments, tracks forecast accuracy, and ultimately allows you to generate true consensus-based forecasts to better anticipate the needs of your customers.

    Thanks to highly flexible product hierarchies, Smart IP&O is perfectly suited to forecasting at the Planning BOM level so you can capture key patterns and incorporate business knowledge at the levels that matter most. Furthermore you can analyze and deploy optimal safety stock levels at any level of your BOM.