We believe the leading edge of supply chain analytics to be the development of digital twins of inventory systems. These twins take the form of discrete event models that use Monte Carlo simulation to generate and optimize over the full range of operational risks. We also assert that we and our colleagues at Smart Software have played an outsized role in forging that leading edge. But we are not alone: there are a small number of other software firms around the globe who are catching up.
So, what’s next for supply chain analytics? Where is the next frontier? It might involve some sort of neural network model of a distribution system. But we’d give better odds on an extension of our leading-edge models of “single echelon” inventory systems to “multi-echelon” inventory systems.
Figures 1 and 2 illustrate the distinction between single and multiple echelon systems. Figure 1 depicts a manufacturer that relies on a Source to replenish its stock of spare parts or components. When stockouts loom, the manufacturer orders replenishment stock from the Source.
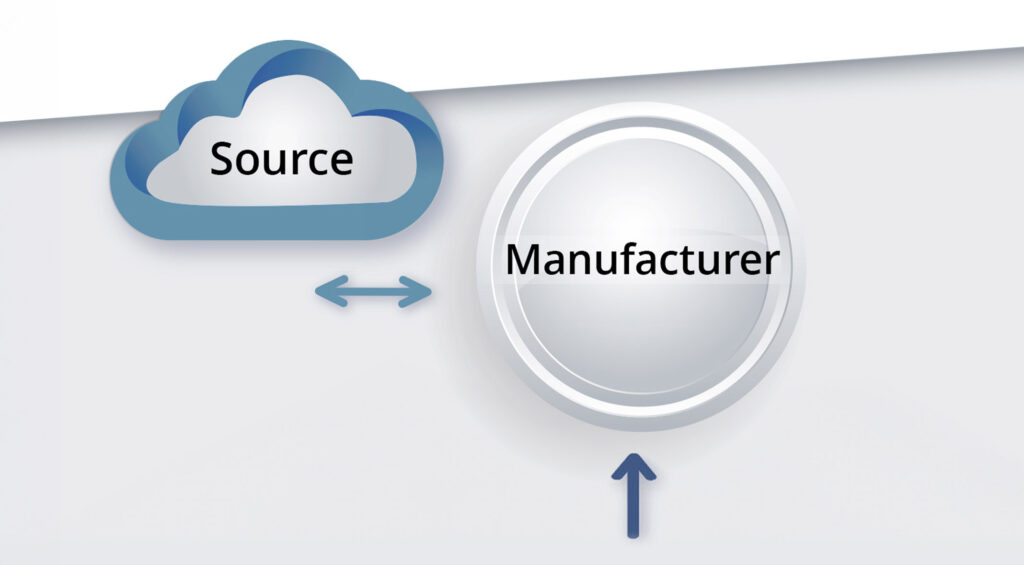
Figure 1: A single-echelon inventory system
Single echelon models do not explicitly include details of the Source. It remains mysterious, an invisible ghost whose only relevant feature is the random time it takes to respond to a replenishment request. Importantly, the Source is implicitly assumed to never itself stock out. That assumption may be “good enough” for many purposes, but it cannot be literally true. It gets handled by stuffing supplier stockout events into the replenishment lead time distribution. Pushing back on that assumption is the rationale for multiechelon modeling.
Figure 2 depicts a simple two-echelon inventory system. It shifts domains from manufacturing to distribution. There are multiple warehouses (WH’s) dependent on a distribution center (DC) for resupply. Now the DC is an explicit part of the model. It has a finite capacity to process orders and requires its own reordering protocols. The DC gets its replenishment from higher up the chain from a Source. The Source might be the manufacturer of the inventory item or perhaps a “regional DC” or something similar, but – guess what? – it is another ghost. As in the single-echelon model, this ghost has one visible characteristic: the probability distribution of its replenishment lead time. (The punch line of a famous joke in physics is “But madame, it’s turtles all the way down.” In our case, “It’s ghosts all the way up.”)
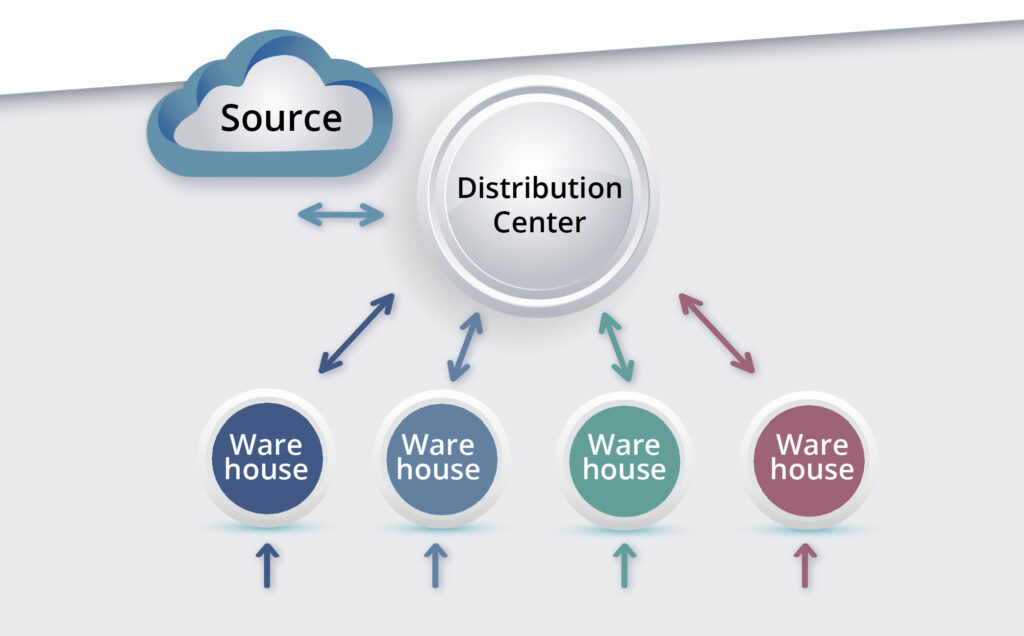
Figure 2: A two-echelon inventory system
The problem of process design and optimization is much harder with two levels. The difficulty is not just the addition of two more control parameters for every WH (e.g., a Min and a Max for each) plus the same two parameters for the DC. Rather, the tougher part is modeling the interaction among the WH’s. In the single-level model, each WH operates in its own little world and never hears “Sorry, we’re stocked out” from the ghostly Source. But in a two-level system, there are multiple WH’s all competing for resupply from their shared DC. This competition creates the main analytical difficulty: the WH’s cannot be modeled in isolation but must be analyzed simultaneously. For instance, if one DC services ten WH’s, there are 2+10×2 = 22 inventory control parameters whose values need to be calculated. In nerd-speak: It is not trivial to solve a 22-variable constrained discrete optimization problem having a stochastic objective function.
If we choose the wrong system design, we discover a new phenomenon inherent in multi-echelon systems, which we informally call “meltdown” or “catastrophe.” In this phenomenon, the DC cannot keep up with the replenishment demands of the WH’s, so it eventually creates stockouts at the warehouse level. Then the WH’s increasingly frantic replenishment requests exhaust the inventory at the DC, which starts its own panicked requests for replenishment from the regional DC. If the regional DC takes too long to refill the DC, then the whole system dissolves into a stockout tragedy.
One solution to the meltdown problem is to overdesign the DC so it almost never runs out, but that can be very expensive, which is why there is a regional DC in the first place. So any affordable system design has a DC that is just good enough to last a long time between meltdowns. This perspective implies a new type of key performance indicator (KPI), such as “Probability of Meltdown within X years is less than Y percent.”
The next frontier will require new methods and new metrics but will offer a new way to design and optimize distribution systems. Our skunk works is already generating prototypes. Watch this space.