Elephants and Kangaroos ERP vs. Best of Breed Demand Planning

“Despite what you’ve seen in your Saturday morning cartoons, elephants can’t jump, and there’s one simple reason: They don’t have to. Most jumpy animals—your kangaroos, monkeys, and frogs—do it primarily to get away from predators.”  — Patrick Monahan, Science.org, Jan 27, 2016.

Now you know why the largest ERP companies can’t develop high quality best-of-breed like solutions. They never had to, so they never evolved to innovate outside of their core focus. 

However, as ERP systems have become commoditized, gaps in their functionality became impossible to ignore. The larger players sought to protect their share of customer wallet by promising to develop innovative add-on applications to fill all the white spaces.  But without that “innovation muscle,” many projects failed, and mountains of technical debt accumulated.

Best-of-breed companies evolved to innovate and have deep functional expertise in specific verticals.  The result is that best of breed ERP add-ons are easier to use, have more features, and deliver more value than the native ERP modules they replace. 

If your ERP provider has already partnered with an innovative best of breed add-on provider*, you’re all set! But if you can only get the basics from your ERP, go with a best-of-breed add-on that has a bespoke integration to the ERP. 

A great place to start your search is to look for ERP demand planning add-ons that add brains to the ERP’s brawn, i.e., those that support inventory optimization and demand forecasting.  Leverage add-on tools like Smart’s statistical forecasting, demand planning, and inventory optimization apps to develop forecasts and stocking policies that are fed back to the ERP system to drive daily ordering. 

*App-stores are a license for the best of breed to sell into the ERP companies base –  being listed  partnerships.


What Silicon Valley Bank Can Learn from Supply Chain Planning

​If you had your head up lately, you may have noticed some additional madness off the basketball court: The failure of Silicon Valley Bank. Those of us in the supply chain world may have dismissed the bank failure as somebody else’s problem, but that sorry episode holds a big lesson for us, too: The importance of stress testing done right.

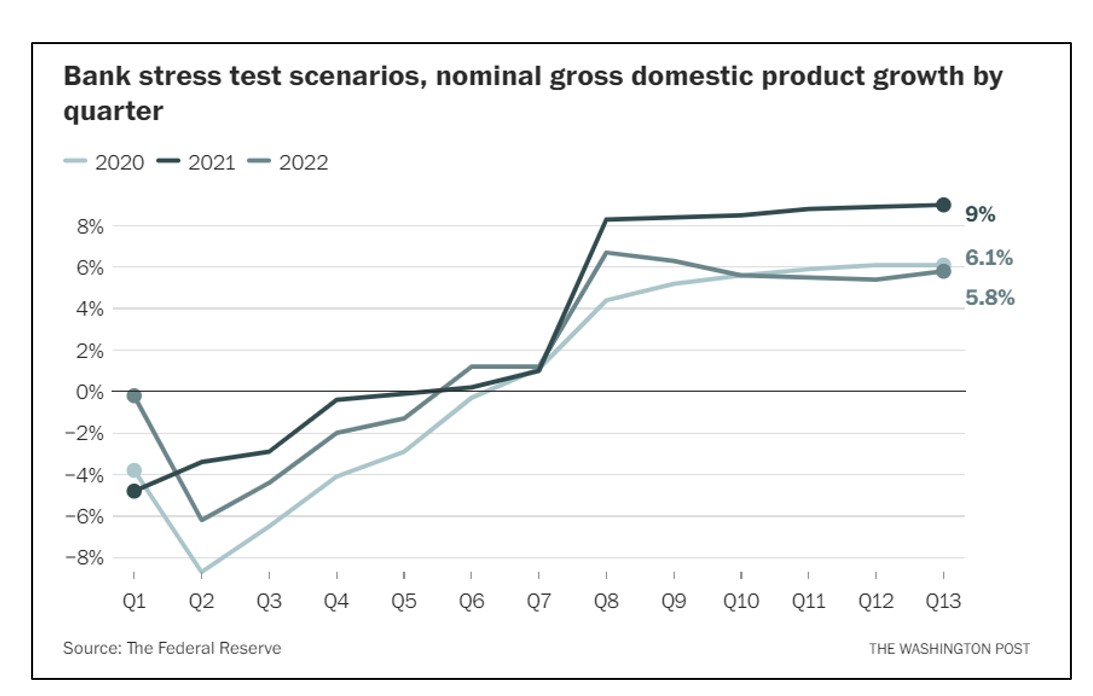
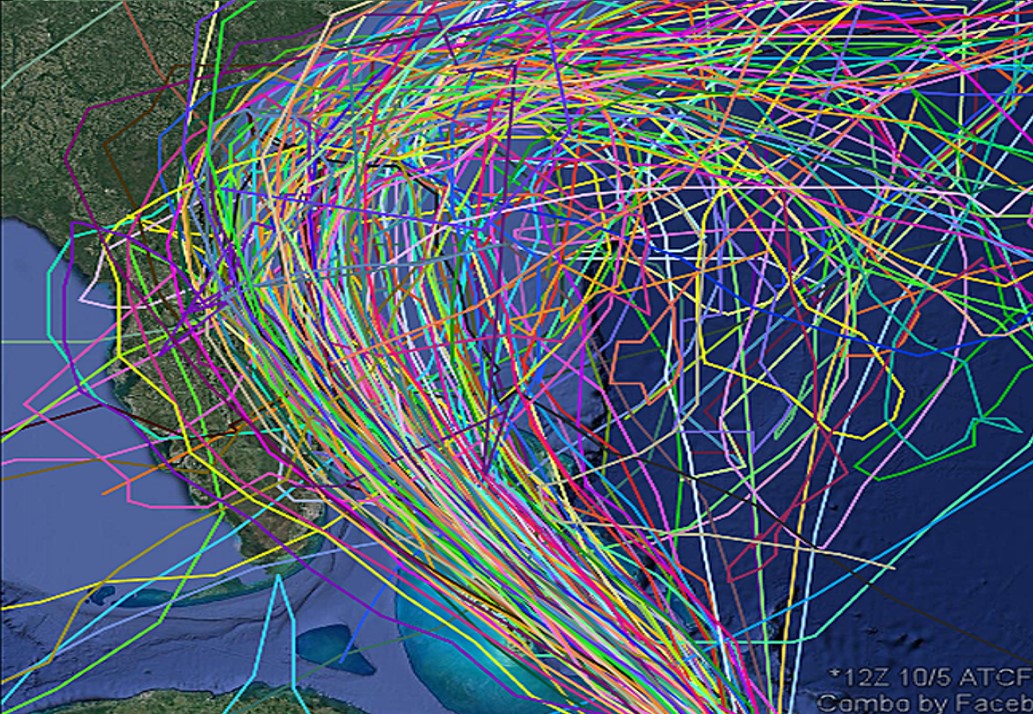
The Washington Post recently carried an opinion piece by Natasha Sarin called “Regulators missed Silicon Valley Bank’s problems for months. Here’s why.” Sarin outlined the flaws in the stress testing regime imposed on the bank by the Federal Reserve. One problem is that the stress tests are too static. The Fed’s stress factor for nominal GDP growth was a single scenario listing presumed values over the next 13 quarters (see Figure 1). Those 13 quarterly projections might be somebody’s consensus view of what a bad hair day would look like, but that’s not the only way things could play out.  As a society, we are being taught to appreciate a better way to display contingencies every time the National Weather Service shows us projected hurricane tracks (see Figure 2). Each scenario represented by a different colored line shows a possible storm path, with the concentrated lines representing the most likely.  By exposing the lower probability paths, risk planning is improved.

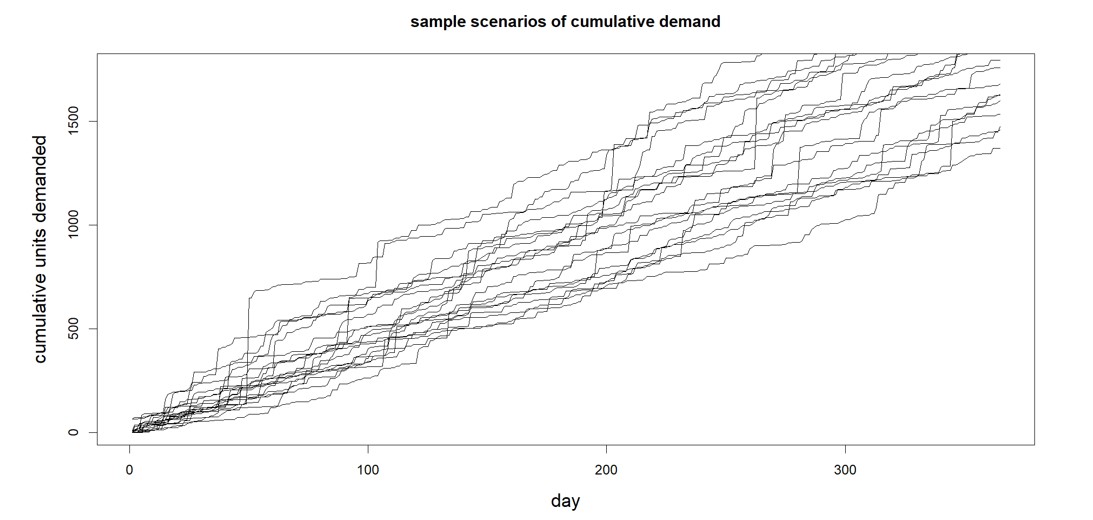
When stress testing the supply chain, we need realistic scenarios of possible future demands that might occur, even extreme demands.   Smart provides this in our software (with considerable improvements in our Gen2 methods).  The software generates a huge number of credible demand scenarios, enough to expose the full scope of risks (see Figure 3). Stress testing is all about generating massive numbers of planning scenarios, and Smart’s probabilistic methods are a radical departure from previous deterministic S&OP applications, being entirely scenario based.

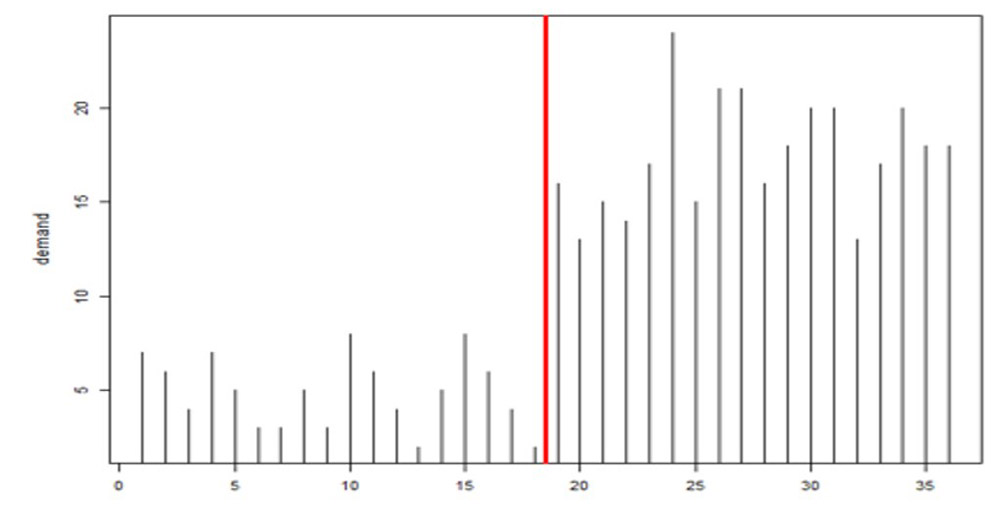
The other flaw in the Fed’s stress tests was that they were designed months in advance but never updated for changing conditions.  Demand planners and inventory managers intuitively appreciate that key variables like item demand and supplier lead time are not only highly random even when things are stable but also subject to abrupt shifts that should require rapid rewriting of planning scenarios (see Figure 4, where the average demand jumps up dramatically between observations 19 and 20). Smart’s Gen2 products include new tech for detecting such “regime changes”  and automatically changing scenarios accordingly.

Banks are forced to undergo stress tests, however flawed they may be, to protect their depositors. Supply chain professionals now have a way to protect their supply chains by using modern software to stress test their demand plans and inventory management decisions.

1 Scenarios used the Fed to stress test banks Software

Figure 1: Scenarios used the Fed to stress test banks.


2 Scenarios used by the National Weather Service to predict hurricane tracks

Figure 2: Scenarios used by the National Weather Service to predict hurricane tracks


3 Demand scenarios of the type generated by Smart Demand Planner

Figure 3: Demand scenarios of the type generated by Smart Demand Planner


4 Example of regime change in product demand after observation #19

Figure 4: Example of regime change in product demand after observation #19


Is your demand planning and forecasting process a black box?

There’s one thing I’m reminded of almost every day at Smart Software that puzzle me: most companies do not understand how forecasts are created, and stocking policies are determined.  It’s an organizational black box. Here is an example from a recent sales call:

How do you forecast?
We use history.

How do you use history?
What do you mean?

Well, you can take an average of the last year, last two years, average the most recent periods, or use some other type of formula to generate the forecast.
I’m pretty sure we use an average of the last 12 months.

Why 12 months instead of a different amount of history?
12 months is a good amount of time to use because it doesn’t get skewed by older data but it’s recent enough

How do you know it’s more accurate than using 18 months or some other length of history?
We don’t know. We do adjust the forecasts based on feedback from sales.  

Do you know if the adjustments make things more accurate or less than if you just used the average?
We don’t know but are confident that forecasts are inflated

What do the inventory buyers do then if they think the numbers are inflated?
They have lots of business knowledge and adjust their buys accordingly

So, is it fair to say they would ignore the forecasts at least some of the time?
Yes, some of the time.

How do the buyers decide when to order more? Do you have a reorder point or safety stock specified in your ERP system that helps guide these decisions?
Yes, we use a safety stock field.

How is safety stock calculated?
Buyers determine this based on the importance of the item, lead times, and other considerations such as how many customers purchase the item, the velocity of the item, it’s cost.  They’ll carry different amounts of safety stock depending on this.

The discussion continued. The main takeaway here is that when you scratch just below the surface, far more questions are revealed than answers.  This often means that the inventory planning and demand forecast process is highly subjective, varies from planner to planner, is not well understood by the rest of the organization, and likely to be reactive.  As Tom Willemain has described it’s “chaos masked by improvisation.”   The “as-is” process needs to be fully identified and documented.  Only then can gaps be exposed, and improvements can be made.   Here is a list of 10 questions  you can ask that will reveal your organization’s true forecasting, demand planning, and inventory planning process.


Spare Parts, Replacement Parts, Rotables, and Aftermarket Parts

What’s the difference, and why it matters for inventory planning.

Those new to the parts planning game are often confused by the many variations in the names of parts. This blog points out distinctions that do or do not have operational significance for someone managing a fleet of spare parts and how those differences impact inventory planning.

For instance, what is the difference between “spare” parts and “replacement” parts? In this case, the difference is their source. A spare part would be purchased from the equipment’s manufacturer, whereas a replacement part would be purchased from a different company. For someone managing a fleet of spares, the difference would be two different entries in their parts database: the source would be different, and the unit price would probably be different. It is possible that there would also be a difference in the useful life of the parts from the two sources. The “OEM” parts might be more durable than the cheaper “aftermarket” parts. (Now we have four different terms describing these parts.) These distinctions would be salient for optimizing an inventory of spares. Software that computes optimal reorder points and order quantities would arrive at different answers for parts with different unit costs and different rates of replacement.

Perhaps the largest distinction is between “consumable” and “repairable” or “rotable” parts. The key distinction between them is their cost. It is foolish to try to repair a stripped screw; just throw it out and use another one. But it is also foolish to throw out a $50,000 component if it can be repaired for $5,000. Optimizing the management of inventory for fleets of each type of part requires very different math. With consumables, the parts can be regarded as anonymous and interchangeable. With “rotatables”, each part must essentially be modeled individually. We treat each as cycling through states of “operational,” “under repair,” and “standby/spare.” Decisions about repairable parts are often handled by a capital budgeting process, and the salient analytical question is, “what should be the size of our spares pool?”

There are other distinctions that can be drawn among parts. Criticality is an important attribute. The consequences of part failure can range from “we can take our time to get a replacement” to “this is an emergency; get those machines back in action pronto”. When working out how to manage parts, we must always strike a balance between the benefits of having a larger stock of parts and the dollar costs. Criticality shifts the balance toward playing it safe with larger inventories. In turn, this dictates higher planning targets for part availability metrics such as service levels and fill rates, which will lead to larger reorder points and/or order quantities.

If you Google “types of spare parts”, you will discover other classifications and distinctions. From our perspective at Smart Software, the words matter less than the numbers associated with parts: unit costs, mean time before failure, mean time to repair and other technical inputs to our products that work out how to manage the parts for maximum benefit.


Spare Parts Planning Software solutions

Smart IP&O’s service parts forecasting software uses a unique empirical probabilistic forecasting approach that is engineered for intermittent demand. For consumable spare parts, our patented and APICS award winning method rapidly generates tens of thousands of demand scenarios without relying on the assumptions about the nature of demand distributions implicit in traditional forecasting methods. The result is highly accurate estimates of safety stock, reorder points, and service levels, which leads to higher service levels and lower inventory costs. For repairable spare parts, Smart’s Repair and Return Module accurately simulates the processes of part breakdown and repair. It predicts downtime, service levels, and inventory costs associated with the current rotating spare parts pool. Planners will know how many spares to stock to achieve short- and long-term service level requirements and, in operational settings, whether to wait for repairs to be completed and returned to service or to purchase additional service spares from suppliers, avoiding unnecessary buying and equipment downtime.

Contact us to learn more how this functionality has helped our customers in the MRO, Field Service, Utility, Mining, and Public Transportation sectors to optimize their inventory. You can also download the Whitepaper here.


White Paper: What you Need to know about Forecasting and Planning Service Parts


This paper describes Smart Software’s patented methodology for forecasting demand, safety stocks, and reorder points on items such as service parts and components with intermittent demand, and provides several examples of customer success.


    Fifteen questions that reveal how forecasts are computed in your company

    In a recent LinkedIn post, I detailed four questions that, when answered, will reveal how forecasts are being used in your business.  In this article, we’ve listed questions you can ask that will reveal how forecasts are created.

    1. When we ask users how they create forecasts, their answer will often be “we use history.” This obviously isn’t enough information, as there are different types of demand history that require different forecasting methods. If you are using historical data, then make sure to find out if you are using an averaging model, a trending model, a seasonal model, or something else to forecast.

    2. Once you know the model used, ask about the parameter values of those models. The forecast output of an “average” will differ, sometimes significantly, depending on the number of periods you are averaging.  So, find out whether you are using an average of the last 3 months, 6 months, 12 months, etc.

    3. If you are using trending models, ask how the model weights are set. For example, in a trending model, such as double exponential smoothing, the forecasts will differ significantly depending on how the calculations weight recent data compared to older data (higher weights put more emphasis on the recent data).

    4. If you are using seasonal models, the forecast results are going to be impacted by the “level” and “trending weights” used. You should also determine whether seasonal periods are forecasted with multiplicative or additive seasonality.  (Additive seasonality says, e.g., “Add 100 units for July”, whereas multiplicative seasonality says “Multiply by 1.25 for July.”) Finally, you may not be using these types of methods at all.  Some practitioners will use a forecast method that simply averages prior periods (i.e., next June will be forecasted based on the average of the prior three Junes).

    5. How do you go about choosing one model over another? Does the choice of technique depend on the type of demand data or when new demand data are available? Is this process automated? Or if a planner chooses a trend model subjectively, will that item continue to be forecasted with that model until the planner changes it again?

    6. Are your forecasts “fully automatic,” so that trend and/or seasonality are detected automatically? Or are your forecasts dependent on item classifications that must be maintained by users? The latter requires more time and attention from planners to define what behavior constitutes trend, seasonality, etc.

    7. What are the item classification rules used? For example, an item may be considered a trending item if demand increases by more than 5% period-over-period. An item may be considered seasonal if 70% or more of the annual demand occurs in four or fewer periods. Such rules are user-defined and often require overly broad assumptions. Sometimes they are configured when a system was originally implemented but never revised even as conditions change. It’s important to make sure any classification rules are understood and, if necessary, updated.

    8. Does the forecast regenerate automatically when new data are available, or do you have to manually regenerate the forecasts?

    9. Do you check for any change in forecast from one period to the next before deciding whether to use the new forecast? Or do you default to the new forecast?

    10. How are forecast overrides that were made in prior planning cycles treated when a new forecast is created? Are they reused or replaced?

    11. How do you incorporate forecasts made by your sales team or by your customers? Do these forecasts replace the baseline forecast, or do you use these inputs to make planner overrides to the baseline forecast?

    12. Under what circumstances would you ignore the baseline forecast and use exactly what sales or customers are telling you?

    13. If you rely on customer forecasts, what do you do about customers who don’t provide forecasts?

    14. How do you document the effectiveness of your forecasting approach?  Most companies only measure the accuracy of the final forecast that is submitted to the ERP system, if they measure anything. But they don’t assess alternative predictions that might have been used. It is important to compare what you are doing to benchmarks. For example, do the methods you are using outperform a naïve forecast (i.e., “tomorrow equals today,” which requires no thought), or what you saw last year, or the average of the last 12 months.  Benchmarking your baseline forecast insures you are squeezing as much accuracy as possible out of the data.

    15. Do you measure whether overrides from sales, customers, and planners are making the forecast better or worse? This is just as important as measuring whether your statistical approaches are outperforming the naïve method.  If you don’t know whether overrides are helping or hurting, the business can’t get better at forecasting – you need to know which steps are adding value so that you can do more of those and get even better. If you aren’t documenting forecast accuracy and conducting “forecast value add” analysis, then you aren’t able to properly assess whether the forecasts being produced are the best you could make.  You’ll miss opportunities to improve the process, increase accuracy, and educate the business on what type of forecast error is to be expected.