Future-Proofing Utilities: Advanced Analytics for Supply Chain Optimization

Utilities have unique supply chain optimization requirements, primarily ensuring high uptime by keeping all critical machines running continuously. Achieving this involves maintaining a high availability of spare parts to guarantee a consistent, reliable, and safe supply. Additionally, as regulated entities, utilities must also carefully manage and control costs.

Managing supply chains efficiently

To maintain a reliable electricity supply at 99.99%+ service levels, for example, utilities must be able to respond quickly to changes in demand in the near term and accurately anticipate future demand. To do so, they must have a well-organized supply chain that allows them to purchase the necessary equipment, materials, and services from the right suppliers at the right time, in the right quantities, and at the right price.

Doing so has become increasingly more challenging in the last 3 years.

  • Requirements for safety, reliability, and service delivery are more stringent.
  • Supply chain disruptions, unpredictable supplier lead times, intermittent spikes in parts usage have always been problematic, but now they are more the rule than the exception.
  • Deregulation in the early 2000’s removed spare parts from the list of directly reimbursed items, forcing utilities to pay for spares directly from revenues[1]
  • The constant need for capital combined with aggressively climbing interest rates mean costs are scrutinized more than ever.

As a result, Supply Chain Optimization (SCO) has become an increasingly mission-critical business practice for utilities.  To contend with these challenges, utilities can no longer simply manage their supply chain — they must optimize it.  And to do that, investments in new processes and systems will be required.

[1] Scala et al. “Risk and Spare Parts Inventory in Electric Utilities”. Proceedings of the Industrial Engineering Research Conference.

Advanced Analytics and Optimization: Future-Proofing Utility Supply Chains

Inventory Planning and Optimization   

Targeted investments in inventory optimization technology offer a path forward for every utility.  Inventory Optimization solutions should be prioritized because they:

  1. Can be implemented in a fraction of the time required for initiatives in other areas, such as warehouse management, supply chain design,  and procurement consolidations. It is not uncommon to start generating benefit after 90 days and to have a full software deployment in less than 180 days.
  2. Can generate massive ROI, yielding 20x returns and seven figure financial benefits annually. By better forecasting parts usage, utilities will reduce costs by purchasing only the necessary inventory while controlling the risk of stockouts that lead to downtime and poor service levels.
  3. Provide foundational support for other initiatives. A strong supply chain rests on the foundation of solid usage forecasts and inventory purchasing plans.

Using predictive analytics and advanced algorithms, inventory optimization helps utilities maximize service levels and reduce operational costs by optimizing inventory levels for spare parts. For example, an electric utility might use statistical forecasting to predict future parts usage, conduct inventory audits to identify excess inventory, and leverage analytical results to identify where inventory optimization efforts should focus first. By doing this, the utility can ensure that machines are running at optimal levels and reduce the risk of costly delays due to a lack of spares.

By using analytics and data, you can identify which spare parts and equipment are most likely to be needed and order only the necessary items. This helps to ensure that equipment has high up-time. It rewards regular monitoring and adjusting of inventory levels so that when operating conditions change, you can detect the change and adjust accordingly. This implies that planning cycles must operate at a tempo high enough to keep up with changing conditions. Leveraging probabilistic forecasting to recalibrate spares stocking policies for each planning cycle ensures that stocking policies (such as min/max levels) are always up-to-date and reflect the latest parts usage and supplier lead times.


Service Levels and the Tradeoff Curve

The Service Level Tradeoff Curve relates inventory investment to item availability as measured by service level. Service level is the probability that no shortages occur between when you order more stock and when it arrives on the shelf. Surprisingly few companies have data on this important metric across their whole fleet of spare parts.

The Service Level Tradeoff Curve exposes the link between the costs associated with different levels of service and the inventory requirements needed to achieve them.  Knowing which components are important to maintaining high service levels is key to the optimization process and is determined by several factors, including inventory item standardization, criticality, historical usage, and known future repair orders. By understanding this relationship, utilities can better allocate resources, as when using the curves to identify areas where costs can be reduced without hurting system reliability.

Service Level tradeoff curve utilities costs inventory requirements Software

With inventory optimization software, setting stocking policies is pure guesswork: It is possible to know how any given increase or decrease will impact service levels other than rough cut estimates.  How the changes will play out in terms of inventory investment, operating costs, and shortage costs, is something no one really knows.  Most utilities rely on rule of thumb methods and arbitrarily adjust stocking policies in a reactive manner after something has gone wrong such as a large stockout or inventory write off.  When adjustments are made this way, there is no fact-based analysis detailing how this change is expected to impact the metrics that matter:  service levels and inventory values.

Inventory Optimization software can compute the detailed, quantitative tradeoff curves required to make informed inventory policy choices or even recommend the target service level that results in the lowest overall operating cost (the sum of holding, ordering, and stock-out costs).  Using this analysis, large increases in stock levels may be mathematically justified when the predicted reduction in shortage costs exceeds the increase in inventory investment and associated holding costs.  By setting appropriate service levels and recalibrating policies across all active parts once every planning cycle (at least once monthly), utilities can minimize the risk of outages while controlling expenditures.

Perhaps the most critical aspects of the response to equipment breakdown are those relating to achieving a first-time fix as rapidly as possible. Having the proper spares available can be the difference between completing a single trip and increasing the mean time to repair, bearing the costs associated with several visits, and causing customer relationships to degrade.

Using modern software, you can benchmark past performance and leverage probabilistic forecasting methods to simulate future performance. By stress-testing your current inventory stocking policies against all plausible scenarios of future parts usage, you will know ahead of time how current and proposed stocking policies are likely to perform. Check out our blog post on how to measure the accuracy of your service level forecast to help you assess the accuracy of inventory recommendations that software providers will purport to provide benefit.


Optimizing Utility Supply Chains Advanced Analytics for Future Readiness


Leveraging Advanced Analytics and AI

When introducing automation, each utility company has its own goals to pursue, but you should begin with assessing present operations to identify areas that may be made more effective. Some companies may prioritize financial issues, but others may prioritize regulatory demands such as clean energy spending or industry-wide changes such as smart grids. Each company’s difficulties are unique, but modern software can point the way to a more effective inventory management system that minimizes excess inventory and places the correct components in the right places at the right times.

Overall, Supply Chain Optimization initiatives are essential for utilities looking to maximize their efficiency and reduce their costs. Technology allows us to make the integration process seamless, and you don’t need to replace your current ERP or EAM system by doing it.  You just need to make better use of the data you already have.

For example, one large utility launched a strategic Supply Chain Optimization (SCO) initiative and added best-in-class capabilities through the selection and integration of commercial off-the-shelf applications.  Chief among these was the Smart Inventory Planning and Optimization system (Smart IP&O), comprising Parts Forecasting / Demand Planning and Inventory Optimization functionality. Within just 90 days the software system was up and running, soon reducing inventory by $9,000,000 while maintaining spares availability at a high level. You can read the case study here Electric Utility Goes with Smart IP&O.

Utilities can ensure that they are able to manage their spare parts supplies in an efficient and cost-effective manner better preparing them for the future.  Over time, this balance between supply and demand translates to a significant edge. Understanding the Service Level Tradeoff Curve helps to understand the costs associated with different levels of service and the inventory requirements needed to achieve them. This leads to reduced operational costs, optimized inventory, and assurance that you can meet your customers’ needs.


Spare Parts Planning Software solutions

Smart IP&O’s service parts forecasting software uses a unique empirical probabilistic forecasting approach that is engineered for intermittent demand. For consumable spare parts, our patented and APICS award winning method rapidly generates tens of thousands of demand scenarios without relying on the assumptions about the nature of demand distributions implicit in traditional forecasting methods. The result is highly accurate estimates of safety stock, reorder points, and service levels, which leads to higher service levels and lower inventory costs. For repairable spare parts, Smart’s Repair and Return Module accurately simulates the processes of part breakdown and repair. It predicts downtime, service levels, and inventory costs associated with the current rotating spare parts pool. Planners will know how many spares to stock to achieve short- and long-term service level requirements and, in operational settings, whether to wait for repairs to be completed and returned to service or to purchase additional service spares from suppliers, avoiding unnecessary buying and equipment downtime.

Contact us to learn more how this functionality has helped our customers in the MRO, Field Service, Utility, Mining, and Public Transportation sectors to optimize their inventory. You can also download the Whitepaper here.


White Paper: What you Need to know about Forecasting and Planning Service Parts


This paper describes Smart Software’s patented methodology for forecasting demand, safety stocks, and reorder points on items such as service parts and components with intermittent demand, and provides several examples of customer success.


    Centering Act: Spare Parts Timing, Pricing, and Reliability

    Just as the renowned astronomer Copernicus transformed our understanding of astronomy by placing the sun at the center of our universe, today, we invite you to re-center your approach to inventory management. And while not quite as enlightening, this advice will help your company avoid being caught in the gravitational pull of inventory woes—constantly orbiting between stockouts, surplus gravity, and the unexpected cosmic expenses of expediting?

    In this article, we’ll walk you through the process of crafting a spare parts inventory plan that prioritizes availability metrics such as service levels and fill rates while ensuring cost efficiency. We’ll focus on an approach to inventory planning called Service Level-Driven Inventory Optimization. Next, we’ll discuss how to determine what parts you should include in your inventory and those that might not be necessary. Lastly, we’ll explore ways to enhance your service-level-driven inventory plan consistently.

    In service-oriented businesses, the consequences of stockouts are often very significant.  Achieving high service levels depends on having the right parts at the right time. However, having the right parts isn’t the only factor. Your Supply Chain Team must develop a consensus inventory plan for every part, then continuously update it to reflect real-time changes in demand, supply, and financial priorities.


    Managing inventory with Service-level-driven planning combines the ability to plan thousands of items with high-level strategic modeling. This requires addressing core issues facing inventory executives:

    • Lack of control over supply and associated lead times.
    • Unpredictable intermittent demand.
    • Conflicting priorities between maintenance/mechanical teams and Materials Management.
    • Reactive “wait and see” approach to planning.
    • Misallocated inventory, causing stockouts and excess.
    • Lack of trust in systems and processes.

    The key to optimal service parts management is to grasp the balance between providing excellent service and controlling costs. To do this, we must compare the costs of stockout with the cost of carrying additional spare parts inventory. The costs of a stockout will be higher for critical or emergency spares, when there is a service level agreement with external customers, for parts used in multiple assets, for parts with longer supplier lead times, and for parts with a single supplier. The cost of inventory may be assessed by considering the unit costs, interest rates, warehouse space that will be consumed, and potential for obsolescence (parts used on a soon-to-be-retired fleet have a higher obsolescence risk, for example).

    To arbitrate how much stock should be put on the shelf for each part, it is critical to establish consensus on the desired key metrics that expose the tradeoffs the business must make to achieve the desired KPIs. These KPIs will include Service Levels that tell you how often you meet usage needs without falling short on stock, Fill Rates that tell you what percentage of demand is filled, and Ordering costs detail the expenses incurred when you place and receive replenishment orders. You also have Holding costs, which encompass expenses like obsolescence, taxes, and warehousing, and Shortage costs that pertain to expenses incurred when stockouts happen.

    An MRO business or Aftermarket Parts Planning team might desire a 99% service level across all parts – i.e., the minimum stockout risk that they are willing to accept is 1%. But what if the amount of inventory needed to support that service level is too expensive? To make an informed decision on whether there is going to be a return on that additional inventory investment, you’ll need to know the stockout costs and compare that to the inventory costs. To get stockout costs, multiply two key elements: the cost per stockout and the projected number of stockouts. To get inventory value, multiply the units required by the unit cost of each part. Then determine the annual holding costs (typically 25-35% of the unit cost). Choose the option that yields a total lower cost. In other words, if the benefit associated with adding more stock (reduced shortage costs) outweighs the cost (higher inventory holding costs), then go for it. A thorough understanding of these metrics and the associated tradeoffs serves as the compass for decision-making.

    Modern software aids in this process by allowing you to simulate a multitude of future scenarios. By doing so, you can assess how well your current inventory stocking strategies are likely to perform in the face of different demand and supply patterns. If anything falls short or goes awry, it’s time to recalibrate your approach, factoring in current data on usage history, supplier lead times, and costs to prevent both stockouts and overstock situations.


    Enhance your service-level-driven inventory plan consistently.

    In conclusion, it’s crucial to assess your service-level-driven plan continuously. By systematically constructing and refining performance scenarios, you can define key metrics and goals, benchmark expected performance, and automate the calculation of stocking policies for all items. This iterative process involves monitoring, revising, and repeating each planning cycle.

    The depth of your analysis within these stocking policies relies on the data at your disposal and the configuration capabilities of your planning system. To achieve optimal outcomes, it’s imperative to maintain ongoing data analysis. This implies that a manual approach to data examination is typically insufficient for the needs of most organizations.

    For information on how Smart Software can help you meet your service supply chain goals with service-driven planning and more, visit the following blogs.

    –   “Explaining What  Service-Level Means in Your Inventory Optimization Software”  Stocking recommendations can be puzzling, especially when they clash with real-world needs.  In this post, we’ll break down what that 99% service level means and why it’s crucial for managing inventory effectively and keeping customers satisfied in today’s competitive landscape.

    –  “Service-Level-Driven Planning for Service Parts Businesses” Service-Level-Driven Service Parts Planning is a four-step process that extends beyond simplified forecasting and rule-of-thumb safety stocks. It provides service parts planners with data-driven, risk-adjusted decision support.

    –   “How to Choose a Target Service Level.” This is a strategic decision about inventory risk management, considering current service levels and fill rates, replenishment lead times, and trade-offs between capital, stocking and opportunity costs.  Learn approaches that can help.

    –   “The Right Forecast Accuracy Metric for Inventory Planning.”  Just because you set a service level target doesn’t mean you’ll actually achieve it. If you are interested in optimizing stock levels, focus on the accuracy of the service level projection. Learn how.


    Spare Parts Planning Software solutions

    Smart IP&O’s service parts forecasting software uses a unique empirical probabilistic forecasting approach that is engineered for intermittent demand. For consumable spare parts, our patented and APICS award winning method rapidly generates tens of thousands of demand scenarios without relying on the assumptions about the nature of demand distributions implicit in traditional forecasting methods. The result is highly accurate estimates of safety stock, reorder points, and service levels, which leads to higher service levels and lower inventory costs. For repairable spare parts, Smart’s Repair and Return Module accurately simulates the processes of part breakdown and repair. It predicts downtime, service levels, and inventory costs associated with the current rotating spare parts pool. Planners will know how many spares to stock to achieve short- and long-term service level requirements and, in operational settings, whether to wait for repairs to be completed and returned to service or to purchase additional service spares from suppliers, avoiding unnecessary buying and equipment downtime.

    Contact us to learn more how this functionality has helped our customers in the MRO, Field Service, Utility, Mining, and Public Transportation sectors to optimize their inventory. You can also download the Whitepaper here.


    White Paper: What you Need to know about Forecasting and Planning Service Parts


    This paper describes Smart Software’s patented methodology for forecasting demand, safety stocks, and reorder points on items such as service parts and components with intermittent demand, and provides several examples of customer success.


      Big Ass Fans Turns to Smart Software as Demand Heats Up

      Big Ass Fans is the best-selling big fan manufacturer in the world, delivering comfort to spaces where comfort seems impossible.  BAF had a problem:  how to reliably plan production to meet demand.  BAF was experiencing a gap between bookings forecasts vs. shipments, and this was impacting revenue and customer satisfaction.  BAF turned to Smart Software for help.

      BAF’s Supply Chain Manager took the lead to flesh out their planning needs and methodically address them.  In his words, “it came down to fundamentals. Our planning process needed to be data driven, collaborative, and continually improved by assessing and enhancing our monthly forecasting process.”

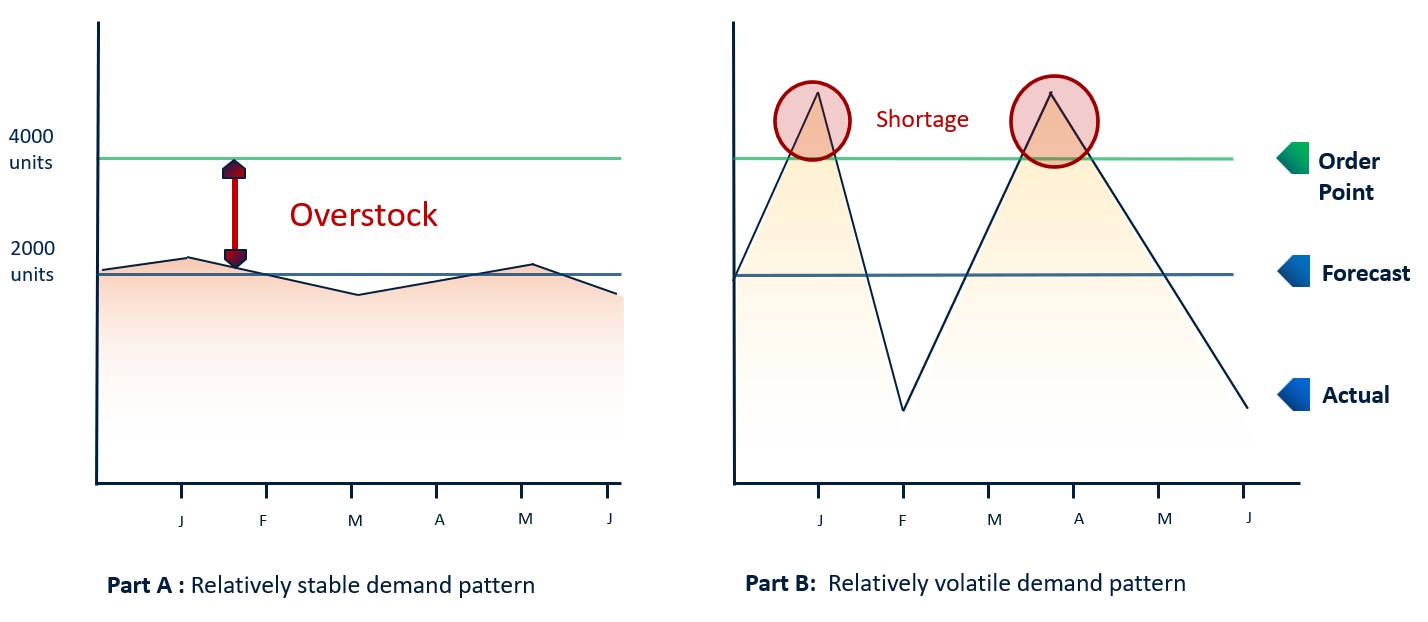
      A big part of this was bringing the disparate planning processes together.  Product managers produce monthly demand forecasts, while the operations team forecasts shipments and associated material requirements.  BAF needed a tighter, data-driven process that combines advanced analytics with team collaboration.  This would need to address seasonality, a huge factor driving demand fluctuations, incorporate input from international as well as US markets, and capture the impact of market promotions.

      BAF’s Customer Service Director and S&OP Team Lead explained what this means.  “Now we have one unified, global process, one shared business view that provides the framework for all of our cross-business planning.”  She likens it to having one source for the truth.  “Every month the entire team sees updated orders and shipments and can compare forecast against actual performance.  Individual managers view business through their required  business lens – by product line or service, region, international geography, channel, customer, you name it.”

      “This is enabling technology that makes us better,” she continued.  “Smart IP&O is, among other things, the vehicle for our monthly SIOP process.  We review our own business segments then convene as a group, consider results to date, the impact of promotions, events and seasonality, and agree on our consensus plan going forward.  This is an invaluable process, enabling manufacturing to stay ahead of demand and deliver what our customers need, when they need it.”

      BAF Case Study SIOP planning Inventory Warehouse

      “Smart Inventory Planning & Optimization is the critical tool we use to manage our forecasts across a large and dynamic set of Products/Parts, multi-national sites, and complex supply chains,” added the Supply Chain Manager.  “The ability of the software to provide a statistical forecast as baseline, allow adjustments by various subject matter experts, each recorded as ‘snapshots’ for consensus building and later use in accuracy/improvement efforts, then ultimately feed the forecast data directly into our Material Requirements Planning software is central to our S&OP process.”

      BAF has refined its monthly Sales, Inventory and Operations Planning process utilizing Smart Demand Planner, Smart’s collaborative forecasting and demand planning application. Smart’s API based bi-directional integration with BAF’s Epicor Kinetic ERP automatically captures all order and shipment data that in turn drives the creation of monthly statistical forecasts.  Through its monthly SIOP process, BAF product managers produce initial forecasts, share these with sales managers who can suggest adjustments, and bring together consensus plans across 25 product lines for monthly review, adjustment, and presentation to the executive team as the company’s rolling 12-month plan.

      The team credits Smart Demand Planner with providing a thorough and accurate forecast of future demand that is central to BAF’s monthly SIOP process.  BAF extended Smart’s utilization to its international offices, where subject matter experts manage their own forecasts.  “Within Smart they can manage both demand forecasts that key on their shipments to local end users and supply forecasts based on their purchase history as key customers to BAF-US.  This significantly enhances our global demand view and has improved forecast accuracy.”

      About Smart Software:

      Founded in 1981, Smart Software, Inc. is a leader in providing businesses with enterprise-wide demand forecasting, planning, and inventory optimization solutions.  Smart Software’s demand forecasting and inventory optimization solutions have helped thousands of users worldwide, including customers such as Disney, Arizona Public Service, and Ameren. Smart’s Inventory Planning & Optimization Platform, Smart IP&O, provides demand planners the tools to handle sales seasonality, promotions, new and aging products, multi-dimensional hierarchies, and intermittently demanded service parts and capital goods items. It also provides inventory managers with accurate estimates of the optimal inventory and safety stock required to meet future orders and achieve desired service levels.  Smart Software is headquartered in Belmont, Massachusetts.  Learn more at www.smartcorp.com.

      BAF Case Study SIOP planning manufacturing

      About Big Ass Fans

      At Big Ass Fans, we are driven by our mission to create safer, healthier, more productive environments worldwide. What started as a big idea in airflow became a revolution and is now best practice for designers, managers, and business owners across every imaginable industry and application. Today, our products are proudly spinning and serving more than 80 percent of the Fortune 500 in 175 countries. From factories to homes and everywhere in between, Big Ass Fans delivers comfort, style, and energy savings to make life more enjoyable. With more than 235 awards, 350 patents, an experiment on the International Space Station and the only HVLS Research & Design lab in the world, we go big every day.

      Procon Pumps Uses Smart Demand Planner to Keep Business Flowing

      Introduction:
      Procon, an industry leading pump manufacturer, uses Smart IP&O’s demand planning and inventory optimization modules from Smart Software to make sure they have the products their customers need, when they need them.  You might not have heard of their products, but if you’ve ever eaten at McDonalds or sipped a coffee at Starbucks, you have been served by Procon.  Procon’s broad portfolio of over 7,000 SKUs is supplied to more than 70 countries worldwide through their direct sales channel and an extensive distributor network.  Procon operates manufacturing facilities in the US, Mexico, Ireland, and through a licensed manufacturing partner in Japan.  We spoke with Procon’s Shankar Suman, Director of Sales, and Emer Horan, Global Supply Chain Manager, to learn more.

      The Challenge
      If Procon cannot ship a required product, their customers cannot ship theirs.  Accurate forecasting is a key driver of supply chain success and customer satisfaction. Procon’s monthly planning establishes the consensus demand plan that drives procurement, production, and stocking policies.  But they found they had a gap between sales and procurement, which historically led to missed deliveries and excess inventory.  What Procon needed was a robust demand forecasting and inventory optimization tool that was easy to use, enabled collaborative planning with their sales team and partners, and integrated with their  ERP system to drive procurement and production planning.

      The Solution:
      They found this in Smart IP&O,  web-based platform for statistical forecasting, demand planning, and inventory optimization.

      • Shankar Suman cited a broad mix of capabilities that convinced them to utilize Smart. Chief among them were:
      •   Smart Demand Planner supports the easy, orchestrated flow of information that yields an accurate consensus plan.  Presenting performance history and statistical forecast by product, territory, and partner, SDP provide the sales team with perspective that they can complement – adjusting for expected opportunities or demand shifts.
      • Forecast accuracy. Smart is an industry leader in statistical analytics, leveraging innovations developed over its forty-plus year history.  This combined with robust forecast vs. actuals analysis helps Procon continually improve the quality of their forecasts.
      • Transparent connectivity with Procon’s enterprise software, Epicor Kinetic. Daily sales and shipment data are automatically pulled into the Smart platform, fueling Smart’s forecasting engine, and results are easily pushed back to the ERP (MRP) via an API based integration to drive ordering and production planning.

      Results:
      Emer Horan explained how this plays out over the course of each month.   Emer provides forecasts for each of their five sales managers, they meet to compare statistical and sales forecasts, and agree on a revised 12-month consensus plan.  The sales managers have a good sense for the top accounts that represent 80% of revenue, often including direct input from customers themselves, and the statistical forecast fills in the gaps.  Next month they use the forecast vs. actual analytics to help improve accuracy, then repeat the process.

      “Our sales team is incentivized to maintain and improve sales forecast accuracy,” said Emer, “and we have the tools to help them succeed.  This not only ensures optimal inventory levels but also contributes to improved on-time delivery and higher customer satisfaction.”

      “Our journey with Smart Software has been quite remarkable,” added Shankar. “We began with an initial idea of the functionality and interface, and it has continually evolved from there. The Smart team has shown tremendous support and patience with our scope changes, delivering the product exactly the way we needed and wanted it.  We have been using Smart for over three years now, and this journey is ongoing. We continue to receive excellent support from the Smart team and truly enjoy working with them.”


      Bottom Line Strategies for Spare Parts Planning

      Managing spare parts presents numerous challenges, such as unexpected breakdowns, changing schedules, and inconsistent demand patterns. Traditional forecasting methods and manual approaches are ineffective in dealing with these complexities. To overcome these challenges, this blog outlines key strategies that prioritize service levels, utilize probabilistic methods to calculate reorder points, regularly adjust stocking policies, and implement a dedicated planning process to avoid excessive inventory. Explore these strategies to optimize spare parts inventory and improve operational efficiency.

      Bottom Line Upfront

      ​1.Inventory Management is Risk Management.

      2.Can’t manage risk well or at scale with subjective planning – Need to know service vs. cost.

      3.It’s not supply & demand variability that are the problem – it’s how you handle it.

      4.Spare parts have intermittent demand so traditional methods don’t work.

      5.Rule of thumb approaches don’t account for demand variability and misallocate stock.

      6.Use Service Level Driven Planning  (service vs. cost tradeoffs) to drive stock decisions.

      7.Probabilistic approaches such as bootstrapping yield accurate estimates of reorder points.

      8.Classify parts and assign service level targets by class.

      9.Recalibrate often – thousands of parts have old, stale reorder points.

      10.Repairable parts require special treatment.


      Do Focus on the Real Root Causes

      Bottom Line strategies for Spare Parts Planning Causes

      Intermittent Demand

      Bottom Line strategies for Spare Parts Planning Intermittent Demand


      • Slow moving, irregular or sporadic with a large percentage of zero values.
      • Non-zero values are mixed in randomly – spikes are large and varied.
      • Isn’t bell shaped (demand is not Normally distributed around the average.)
      • At least 70% of a typical Utility’s parts are intermittently demanded.

      Bottom Line strategies for Spare Parts Planning 4


      Normal Demand

      Bottom Line strategies for Spare Parts Planning Intermittent Demand

      • Very few periods of zero demand (exception is seasonal parts.)
      • Often exhibits trend, seasonal, or cyclical patterns.
      • Lower levels of demand variability.
      • Is bell-shaped (demand is Normally distributed around the average.)

      Bottom Line strategies for Spare Parts Planning 5

      Don’t rely on averages

      Bottom Line strategies for Spare Parts Planning Averages

      • OK for determining typical usage over longer periods of time.
      • Often forecasts more “accurately” than some advanced methods.
      • But…insufficient for determining what to stock.


      Don’t Buffer with Multiples of Averages

      Example:  Two equally important parts so let’s treat them the same.
      We’ll order more  when On Hand Inventory ≤ 2 x Avg Lead Time Demand.

      Bottom Line strategies for Spare Parts Planning Multiple Averages


      Do use Service Level tradeoff curves to compute safety stock

      Bottom Line strategies for Spare Parts Planning Service Level

      Standard Normal Probabilities

      OK for normal demand. Doesn’t work with intermittent demand!

      Bottom Line strategies for Spare Parts Planning Standard Probabilities


      Don’t use Normal (Bell Shaped) Distributions

      • You’ll get the tradeoff curve wrong:

      – e.g., You’ll target 95% but achieve 85%.

      – e.g., You’ll target 99% but achieve 91%.

      • This is a huge miss with costly implications:

      – You’ll stock out more often than expected.

      – You’ll start to add subjective buffers to compensate and then overstock.

      – Lack of trust/second-guessing of outputs paralyzes planning.


      Why Traditional Methods Fail on Intermittent Demand: 

      Traditional Methods are not designed to address core issues in spare parts management.

      Need: Probability distribution (not bell-shaped) of demand over variable lead time.

      • Get: Prediction of average demand in each month, not a total over lead time.
      • Get: Bolted-on model of variability, usually the Normal model, usually wrong.

      Need: Exposure of tradeoffs between item availability and cost of inventory.

      • Get: None of this; instead, get a lot of inconsistent, ad-hoc decisions.


      Do use Statistical Bootstrapping to Predict the Distribution:

      Then exploit the distribution to optimize stocking policies.

      Bottom Line strategies for Spare Parts Planning Predict Distribution


      How does Bootstrapping Work?

      24 Months of Historical Demand Data.

      Bottom Line strategies for Spare Parts Planning Bootstrapping 1

      Bootstrap Scenarios for a 3-month Lead Time.

      Bottom Line strategies for Spare Parts Planning Bootstrapping 2

      Bootstrapping Hits the Service Level Target with nearly 100% Accuracy!

      • National Warehousing Operation.

      Task: Forecast inventory stocking levels for 12,000 intermittently demanded SKUs at 95% & 99% service levels

      Results:

      At 95% service level, 95.23% did not stock out.

      At 99% service level, 98.66% did not stock out.

      This means you can rely on output to set expectations and confidently make targeted stock adjustments that lower inventory and increase service.


      Set Target Service Levels According to Order Frequency & Size

      Set Target Service Levels According to Order Frequency


      Recalibrate Reorder Points Frequently

      • Static ROPs cause excess and shortages.
      • As lead time increases, so should the ROP and vice versa.
      • As usage decreases, so should the ROP and vice versa.
      • Longer you wait to recalibrate, the greater the imbalance.
      • Mountains of parts ordered too soon or too late.
      • Wastes buyers’ time placing the wrong orders.
      • Breeds distrust in systems and forces data silos.

      Recalibrate Reorder Points Frequently

      Do Plan Rotables (Repair Parts) Differently

      Do Plan Rotables (Repair Parts) Differently


      Summary

      1.Inventory Management is Risk Management.

      2.Can’t manage risk well or at scale with subjective planning – Need to know service vs. cost.

      3.It’s not supply & demand variability that are the problem – it’s how you handle it.

      4.Spare parts have intermittent demand so traditional methods don’t work.

      5.Rule of thumb approaches don’t account demand variability and misallocate stock.

      6.Use Service Level Driven Planning  (service vs. cost tradeoffs) to drive stock decisions.

      7.Probabilistic approaches such as bootstrapping yield accurate estimates of reorder points.

      8.Classify parts and assign service level targets by class.

      9.Recalibrate often – thousands of parts have old, stale reorder points.

      10.Repairable parts require special treatment.


      Spare Parts Planning Software solutions

      Smart IP&O’s service parts forecasting software uses a unique empirical probabilistic forecasting approach that is engineered for intermittent demand. For consumable spare parts, our patented and APICS award winning method rapidly generates tens of thousands of demand scenarios without relying on the assumptions about the nature of demand distributions implicit in traditional forecasting methods. The result is highly accurate estimates of safety stock, reorder points, and service levels, which leads to higher service levels and lower inventory costs. For repairable spare parts, Smart’s Repair and Return Module accurately simulates the processes of part breakdown and repair. It predicts downtime, service levels, and inventory costs associated with the current rotating spare parts pool. Planners will know how many spares to stock to achieve short- and long-term service level requirements and, in operational settings, whether to wait for repairs to be completed and returned to service or to purchase additional service spares from suppliers, avoiding unnecessary buying and equipment downtime.

      Contact us to learn more how this functionality has helped our customers in the MRO, Field Service, Utility, Mining, and Public Transportation sectors to optimize their inventory. You can also download the Whitepaper here.


      White Paper: What you Need to know about Forecasting and Planning Service Parts


      This paper describes Smart Software’s patented methodology for forecasting demand, safety stocks, and reorder points on items such as service parts and components with intermittent demand, and provides several examples of customer success.