Probabilistic Forecasting for Intermittent Demand

The Smart Forecaster

  Pursuing best practices in demand planning,

forecasting and inventory optimization

Intermittent, lumpy or uneven demand —particularly for low-demand items like service and spare parts — is especially difficult to predict with any accuracy. Smart Software’s proprietary probabilistic forecasting dramatically improves service level accuracy.  If any of these scenarios apply to your company then probabilistic forecasting will help improve your bottom line.

  • Do you have intermittent or lumpy demand with large, infrequent spikes that are many times the average demand?
  • Is it hard to obtain business information about when demand is likely to spike again?
  • Do you miss out on business opportunities because you can’t accurately forecast demand and estimate inventory requirements for certain unpredictable products?
  • Are you required to hold inventory on many items even if they are infrequently demanded in order to differentiate vs. the competition by providing high service levels?
  • Do you have to make unnecessarily large investments in inventory to cover unexpected orders and materials requirements?
  • Do you have to deliver to customers right away despite long supplier lead times?

If you’ve answered yes to some or all of the questions above, you aren’t alone. Intermittent demand —also known as irregular, sporadic, lumpy, or slow-moving demand — affects industries of all types and sizes: capital goods and equipment sectors, automotive, aviation, public transit, industrial tools, specialty chemicals, utilities and high tech, to name just a few. And it makes demand forecasting and planning extremely difficult. It can be much more than a headache; it can be a multi-million-dollar problem, especially for MRO businesses and others who manage and distribute spare and service parts.

Identifying intermittent demand data isn’t hard. It typically contains a large percentage of zero values, with non-zero values mixed in randomly. But few forecasting solutions have yielded satisfactory results even in this era of Big Data Analysis, Predictive Analytics, Machine Learning, and Artificial Intelligence.


DOWNLOAD THE ARTICLE

Traditional Approaches and their Reliance on an Assumed Demand Distribution

Traditional statistical forecasting methods, like exponential smoothing and moving averages, work well when product demand data is normal, or smooth, but it doesn’t give accurate results with intermittent data. Many automated forecasting tools fail because they work by identifying patterns in demand history data, such as trend and seasonality. But with intermittent demand data, patterns are especially difficult to recognize. These methods also tend to ignore the special role of zero values in analyzing and forecasting demand.Even so, some conventional statistical forecasting methods can produce credible forecasts of the average demand per period.  However, when demand is intermittent, a forecast of the average demand is not nearly sufficient for inventory planning.  Accurate estimates of the entire distribution (i.e., complete set) of all possible lead-time demand values is needed. Without this, these methods produce misleading inputs to inventory control models — with costly consequences.

Collague with gears ans statistical forecast modeling


To produce reorder points, order-up-to levels, and safety stocks for inventory planning, many forecasting approaches rely on assumptions about the demand and lead time distribution.  Some assume that the probability distribution of total demand for a particular product item over a lead time (lead-time demand) will resemble a normal, classic bell-shaped curve. Other approaches might rely on a Poisson distribution or some other textbook distribution.  With intermittent demand, a one-sized fits all approach is problematic because the actual distribution will often not match the assumed distribution.  When this occurs, estimates of the buffer stock will be wrong.  This is especially the case when managing spare parts (Table 1).

For each intermittently demanded item, the importance of having an accurate forecast of the entire distribution of all possible lead time demand values — not just one number representing the average or most likely demand per period — cannot be overstated. These forecasts are key inputs to the inventory control models that recommend correct procedures for the timing and size of replenishment orders (reorder points and order quantities). They are particularly essential in spare parts environments, where they are needed to accurately estimate customer service level inventory requirements (e.g., a 95 or 99 percent likelihood of not stocking out of an item) for satisfying total demand over a lead time.  Inventory planning departments must be confident that when they target a desired service level that they will achieve that target.  If the forecasting model consistently yields a different service level than targeted, inventory will be mismanaged and confidence in the system will erode.

Faced with this challenge, many organizations rely on applying rule of thumb based approaches to determine stocking levels or will apply judgmental adjustments to their statistical forecasts, which they hope will more accurately predict future activity based on past business experience. But there are several problems with these approaches, as well.

Rule of thumb approaches ignore variability in demand and lead time. They also do not update for changes in demand patterns and don’t provide critical trade-off information about the relationship between service levels and inventory costs.

Judgmental forecasting is not feasible when dealing with large numbers (thousands and tens of thousands) of items. Furthermore, most judgmental forecasts provide a single-number estimate instead of a forecast of the full distribution of lead-time demand values. Finally, it is easy to inadvertently but incorrectly predict a downward (or upward) trend in demand, based on expectations, resulting in understocking (or over-stocking) inventory.


How does Probabilistic Demand Forecasting Work in Practice?

Although the full architecture of this technology includes additional proprietary features, a simple example of the approach demonstrates the usefulness of the technique. See Table 1.

intermittently demanded product items spreedsheet

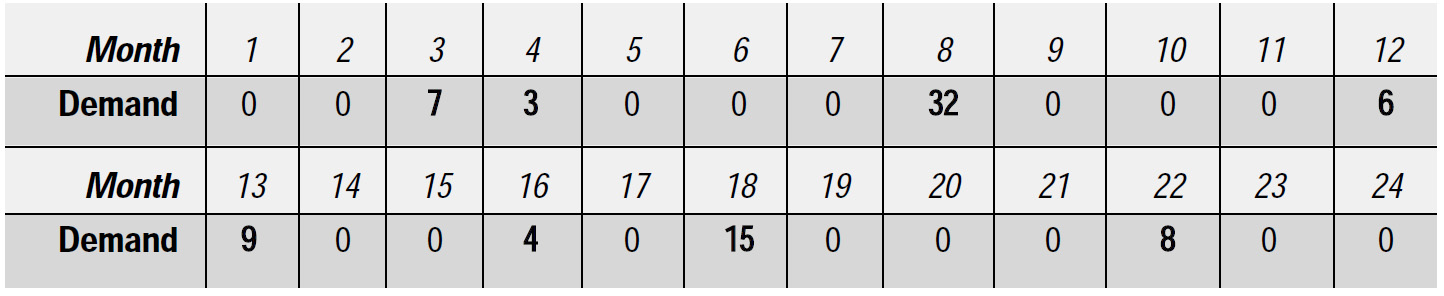
Table 1. Monthly demand values for a service part item.

The 24 monthly demand values for a service part itemare typical of intermittent demand. Let’s say you need forecasts of total demand for this item over the next three months because your parts supplier needs three months to fill an order to replenish inventory. The probabilistic approach is to sample from the 24 monthly values, with replacement, three times, creating a scenario of total demand over the three-month lead time.

How does the new method of forecasting intermittent demand work

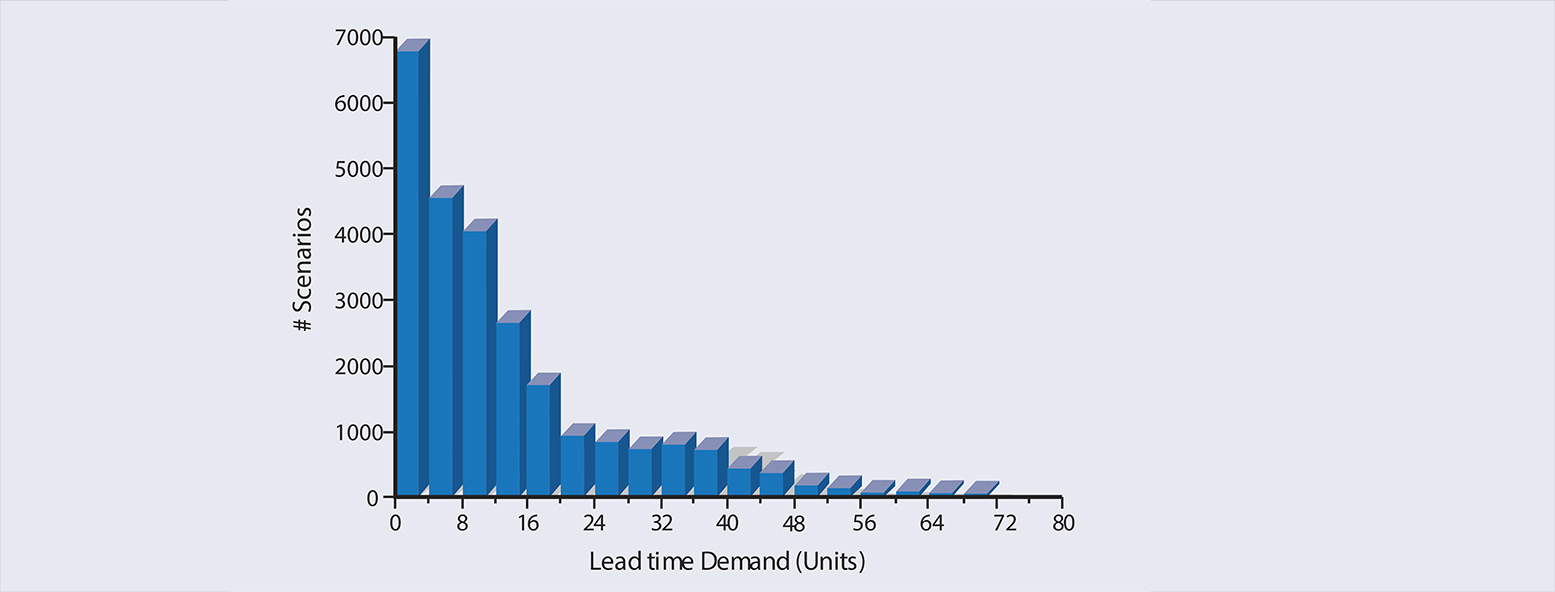
Figure 1. The results of 25,000 scenarios.


You might randomly select months 6, 12 and 4, which gives you demand values of 0, 6 and 3, respectively, for a total lead-time demand (in units) of 0 + 6 + 3 = 9. You then repeat this process, perhaps randomly selecting months 19, 8 and 14, which gives a lead-time demand of 0 + 32 + 0 = 32 units. Continuing this process, you can build a statistically rigorous picture of the entire distribution of possible lead-time demand values for this item. Figure 1 shows the results of 25,000 such scenarios, indicating (in this example) that the most likely value for lead-time demand is zero but that lead-time demand could be as great as 70 or more units. It also reflects the real-life possibility that nonzero demand values for the part item occurring in the future could differ from those that have occurred in the past.

With the high-speed computational resources available in the cloud today, probabilistic forecasting methods can provide fast and realistic forecasts of total lead-time demand for thousands or tens of thousands of intermittently demanded product items. These forecasts can then be entered directly into inventory control models to insure that enough inventory is available to satisfy customer demand. This also ensures that no more inventory than necessary is maintained, minimizing costs.


A Field Proven Method That Works

Customers that have implemented the technology have found that it increases customer service level accuracy and significantly reduces inventory costs.

Warehouse or storage getting inventory optimization

A nationwide hardware retailer’s warehousing operation forecasted inventory requirements for 12,000 intermittently demanded SKUs at 95 and 99 percent service levels. The forecast results were almost 100 percent accurate. At the 95 percent service level, 95.23 percent of the items did not stock out (95 percent would have been perfect). At the 99 percent service level, 98.66 percent of the items did not stock out (99 percent would have been perfect).

The aircraft maintenance operation of a global company got similar service level forecasting results with 6,000 SKUs. Potential annual savings in inventory carrying costs were estimated at $3 million. The aftermarket business unit of an automotive industry supplier, two-thirds of whose 7,000 SKUs demonstrate highly intermittent demand, also projected $3 million in annual cost savings.

That the challenge of forecasting intermittent product demand has indeed been met is good news for manufacturers, distributors, and spare parts/MRO businesses.  With cloud computing, Smart Software’s field-proven probabilistic method is now accessible to the non-statistician and can be applied at scale to tens of thousands of parts.  Demand data that was once un-forecastable no longer poses an obstacle to achieving the highest customer service levels with the lowest possible investment in inventory.


Hand placing pieces to build an arrow

DOWNLOAD THE ARTICLE

Leave a Comment

Related Posts

The Cost of Spreadsheet Planning

The Cost of Spreadsheet Planning

Companies that depend on spreadsheets for demand planning, forecasting, and inventory management are often constrained by the spreadsheet’s inherent limitations. This post examines the drawbacks of traditional inventory management approaches caused by spreadsheets and their associated costs, contrasting these with the significant benefits gained from embracing state-of-the-art planning technologies.

Finding Your Spot on the Inventory Tradeoff Curve

Finding Your Spot on the Inventory Tradeoff Curve

This video blog holds essential insights for those working with the complexities of inventory management. The session focuses on striking the right balance within the inventory tradeoff curve, inviting viewers to understand the deep-seated importance of this equilibrium.

Why MRO Businesses Need Add-on Service Parts Planning & Inventory Software

Why MRO Businesses Need Add-on Service Parts Planning & Inventory Software

MRO organizations exist in a wide range of industries, including public transit, electrical utilities, wastewater, hydro power, aviation, and mining. To get their work done, MRO professionals use Enterprise Asset Management (EAM) and Enterprise Resource Planning (ERP) systems. These systems are designed to do a lot of jobs. Given their features, cost, and extensive implementation requirements, there is an assumption that EAM and ERP systems can do it all. In this post, we summarize the need for add-on software that addresses specialized analytics for inventory optimization, forecasting, and service parts planning.

Recent Posts

  • Epicor AI Forecasting and Inventory Technology Combined with Planner Knowledge for InsightsSmart Software to Present at Epicor Insights 2024
    Smart Software will present at this year's Epicor Insights event in Nashville. If you plan to attend this year, please join us at booth #13 or #501, and learn more about Epicor Smart Inventory Planning and Optimization. . […]
  • Looking for Trouble in Your Inventory DataLooking for Trouble in Your Inventory Data
    In this video blog, the spotlight is on a critical aspect of inventory management: the analysis and interpretation of inventory data. The focus is specifically on a dataset from a public transit agency detailing spare parts for buses. […]
  • BAF Case Study SIOP planning Distribution CenterBig Ass Fans Turns to Smart Software as Demand Heats Up
    Big Ass Fans is the best-selling big fan manufacturer in the world, delivering comfort to spaces where comfort seems impossible. BAF had a problem: how to reliably plan production to meet demand. BAF was experiencing a gap between bookings forecasts vs. shipments, and this was impacting revenue and customer satisfaction BAF turned to Smart Software for help. […]
  • The Cost of Doing nothing with your inventory Planning SystemsThe Cost of Spreadsheet Planning
    Companies that depend on spreadsheets for demand planning, forecasting, and inventory management are often constrained by the spreadsheet’s inherent limitations. This post examines the drawbacks of traditional inventory management approaches caused by spreadsheets and their associated costs, contrasting these with the significant benefits gained from embracing state-of-the-art planning technologies. […]
  • Randomness can be an Ally in the Forecasting BattleCan Randomness be an Ally in the Forecasting Battle?
    When we try to understand the complex world of logistics, randomness plays a pivotal role. This introduces an interesting paradox: In a reality where precision and certainty are prized, could the unpredictable nature of supply and demand actually serve as a strategic ally? The quest for accurate forecasts is not just an academic exercise; it's a critical component of operational success across numerous industries. For demand planners who must anticipate product demand, the ramifications of getting it right—or wrong—are critical. Hence, recognizing and harnessing the power of randomness isn't merely a theoretical exercise; it’s a necessity for resilience and adaptability in an ever-changing environment. […]

    Inventory Optimization for Manufacturers, Distributors, and MRO

    • Why MRO Businesses Need Add-on Service Parts Planning & Inventory SoftwareWhy MRO Businesses Need Add-on Service Parts Planning & Inventory Software
      MRO organizations exist in a wide range of industries, including public transit, electrical utilities, wastewater, hydro power, aviation, and mining. To get their work done, MRO professionals use Enterprise Asset Management (EAM) and Enterprise Resource Planning (ERP) systems. These systems are designed to do a lot of jobs. Given their features, cost, and extensive implementation requirements, there is an assumption that EAM and ERP systems can do it all. In this post, we summarize the need for add-on software that addresses specialized analytics for inventory optimization, forecasting, and service parts planning. […]
    • Spare-parts-demand-forecasting-a-different-perspective-for-planning-service-partsThe Forecast Matters, but Maybe Not the Way You Think
      True or false: The forecast doesn't matter to spare parts inventory management. At first glance, this statement seems obviously false. After all, forecasts are crucial for planning stock levels, right? It depends on what you mean by a “forecast”. If you mean an old-school single-number forecast (“demand for item CX218b will be 3 units next week and 6 units the week after”), then no. If you broaden the meaning of forecast to include a probability distribution taking account of uncertainties in both demand and supply, then yes. […]
    • Whyt MRO Businesses Should Care about Excess InventoryWhy MRO Businesses Should Care About Excess Inventory
      Do MRO companies genuinely prioritize reducing excess spare parts inventory? From an organizational standpoint, our experience suggests not necessarily. Boardroom discussions typically revolve around expanding fleets, acquiring new customers, meeting service level agreements (SLAs), modernizing infrastructure, and maximizing uptime. In industries where assets supported by spare parts cost hundreds of millions or generate significant revenue (e.g., mining or oil & gas), the value of the inventory just doesn’t raise any eyebrows, and organizations tend to overlook massive amounts of excessive inventory. […]
    • Top Differences between Inventory Planning for Finished Goods and for MRO and Spare PartsTop Differences Between Inventory Planning for Finished Goods and for MRO and Spare Parts
      In today’s competitive business landscape, companies are constantly seeking ways to improve their operational efficiency and drive increased revenue. Optimizing service parts management is an often-overlooked aspect that can have a significant financial impact. Companies can improve overall efficiency and generate significant financial returns by effectively managing spare parts inventory. This article will explore the economic implications of optimized service parts management and how investing in Inventory Optimization and Demand Planning Software can provide a competitive advantage. […]

      Four Ways to Optimize Inventory

      The Smart Forecaster

       Pursuing best practices in demand planning,

      forecasting and inventory optimization

      Now More than Ever

      Inventory optimization has become an even higher priority in recent months for many of our customers.  Some are finding their products in vastly greater demand; more have the opposite problem. In either case, events like the Covid19 pandemic are forcing a reexamination of standard operating conditions, such as choices of reorder points and order quantities.

      Even in quieter times, inventory control parameters like Mins and Maxes may be set far from their best values. We may ask “Why is the reorder point for SKU_1234 set at 20 units and the order quantify set at 35?” Those choices were probably the ossified result of years of accumulated guesses. A little investigation may show that the choices of 20 and 35 are no longer properly aligned with current demand level, demand volatility, supplier lead time and item costs.

      The nagging feeling that “We should re-think all these choices” is often followed by “Oh no, we have to figure this out for all 10,000 items in inventory?” The savior here is advanced software that can scale up the process and make it not only desirable but feasible.  The software uses sophisticated algorithms to translate changes in inventory parameters such as reorder points into key performance indicators such as service levels and operating costs (defined as the sum of holding costs, ordering costs, and shortage costs).

      This blog describes how to gain the benefits of inventory optimization by outlining 4 approaches with varying degrees of automation.

      Four Approaches to Inventory Optimization


      Hunt-and Peck

      The first way is item-specific “hunt and peck” optimization. That is, you isolate one inventory item at a time and make “what if” guesses about how to manage that item. For instance, you may ask software to evaluate what happens if you change the reorder point for SKU123 from 20 to 21 while leaving the order quantity fixed at 35. Then you might try leaving 20 alone and reducing 35 to 34. Hours later, because your intuitions are good, you may have hit on a better pair of choices, but you don’t know if there is an even better combination that you didn’t try, and you may have to move on to the next SKU and the next and the next… You need something more automated and comprehensive.

      There are three ways to get the job done more productively. The first two combine your intuition with the efficiency of treating groups of related items. The third is a fully automatic search.

      Service-level Driven Optimization

      1. Identify items that you want to all have the same service level. For instance, you might manage hundreds of “C” items and wonder whether their service level target should be 70%, or more, or less.
      2. Input a potential service level target and have the software predict the consequences in terms of inventory dollar investment and inventory operating cost.
      3. If you don’t like what you see, try another service level target until you are comfortable. Here the software does group-level predictions of the consequences of your choices, but you are still exploring your choices.

      Optimization by Reallocation from a Benchmark

      1. Identify items that are related in some way, such as “all spares for undercarriages of light rail vehicles.”
      2. Use the software to assess the current spectrum of service levels and costs across the group of items. Usually, you will discover some items to be grossly overstocked (as indicated by service levels unreasonably high) and others grossly understocked (service levels embarrassingly low).
      3. Use the software to calculate the changes needed to lower the highest service levels and raise the lowest. This adjustment will often result in achieving two goals at once: increasing average service level while simultaneously decreasing average operating costs.

      Fully automated, Item-Specific Optimization

      1. Identify items that all require service levels above a certain minimum. For instance, maybe you want all your “A” items to have at least a 95% service level.
      2. Use the software to identify, for each item, the choice of inventory parameters that will minimize the cost of meeting or exceeding the service level minimum. The software will efficiently search the “design space” defined by pairs of inventory parameters (e.g., Min and Max) for designs (e.g., Min=10, Max=23) that satisfy the service level constraint. Among those, it will identify the least cost design.

      This approach goes farthest to shift the burden from the planner to the program. Many would benefit from making this the standard way they manage huge numbers of inventory items. For some items, it may be useful to put in a little more time to make sure that additional considerations are also accounted for. For instance, limited capacity in a purchasing department may force the solution away from the ideal by requiring a decrease in the frequency of orders, despite the price paid in higher overall operating costs.

      Going Forward

      Optimizing inventory parameters has never been more important, but it has always seemed like an impossible dream: it was too much work, and there were no good models to relate parameter choices to key performance indicators like service level and operating cost. Modern software for supply chain analytics has changed the game. Now the question is not “Why would we do that?” but “Why are we not doing that?” With software, you can connect “Here’s what we want” to “Make it so.”


      Volume and color boxes in a warehouese


      Leave a Comment
      Related Posts
      The Cost of Spreadsheet Planning

      The Cost of Spreadsheet Planning

      Companies that depend on spreadsheets for demand planning, forecasting, and inventory management are often constrained by the spreadsheet’s inherent limitations. This post examines the drawbacks of traditional inventory management approaches caused by spreadsheets and their associated costs, contrasting these with the significant benefits gained from embracing state-of-the-art planning technologies.

      Finding Your Spot on the Inventory Tradeoff Curve

      Finding Your Spot on the Inventory Tradeoff Curve

      This video blog holds essential insights for those working with the complexities of inventory management. The session focuses on striking the right balance within the inventory tradeoff curve, inviting viewers to understand the deep-seated importance of this equilibrium.

      Why MRO Businesses Need Add-on Service Parts Planning & Inventory Software

      Why MRO Businesses Need Add-on Service Parts Planning & Inventory Software

      MRO organizations exist in a wide range of industries, including public transit, electrical utilities, wastewater, hydro power, aviation, and mining. To get their work done, MRO professionals use Enterprise Asset Management (EAM) and Enterprise Resource Planning (ERP) systems. These systems are designed to do a lot of jobs. Given their features, cost, and extensive implementation requirements, there is an assumption that EAM and ERP systems can do it all. In this post, we summarize the need for add-on software that addresses specialized analytics for inventory optimization, forecasting, and service parts planning.

      Recent Posts

      • Epicor AI Forecasting and Inventory Technology Combined with Planner Knowledge for InsightsSmart Software to Present at Epicor Insights 2024
        Smart Software will present at this year's Epicor Insights event in Nashville. If you plan to attend this year, please join us at booth #13 or #501, and learn more about Epicor Smart Inventory Planning and Optimization. . […]
      • Looking for Trouble in Your Inventory DataLooking for Trouble in Your Inventory Data
        In this video blog, the spotlight is on a critical aspect of inventory management: the analysis and interpretation of inventory data. The focus is specifically on a dataset from a public transit agency detailing spare parts for buses. […]
      • BAF Case Study SIOP planning Distribution CenterBig Ass Fans Turns to Smart Software as Demand Heats Up
        Big Ass Fans is the best-selling big fan manufacturer in the world, delivering comfort to spaces where comfort seems impossible. BAF had a problem: how to reliably plan production to meet demand. BAF was experiencing a gap between bookings forecasts vs. shipments, and this was impacting revenue and customer satisfaction BAF turned to Smart Software for help. […]
      • The Cost of Doing nothing with your inventory Planning SystemsThe Cost of Spreadsheet Planning
        Companies that depend on spreadsheets for demand planning, forecasting, and inventory management are often constrained by the spreadsheet’s inherent limitations. This post examines the drawbacks of traditional inventory management approaches caused by spreadsheets and their associated costs, contrasting these with the significant benefits gained from embracing state-of-the-art planning technologies. […]
      • Randomness can be an Ally in the Forecasting BattleCan Randomness be an Ally in the Forecasting Battle?
        When we try to understand the complex world of logistics, randomness plays a pivotal role. This introduces an interesting paradox: In a reality where precision and certainty are prized, could the unpredictable nature of supply and demand actually serve as a strategic ally? The quest for accurate forecasts is not just an academic exercise; it's a critical component of operational success across numerous industries. For demand planners who must anticipate product demand, the ramifications of getting it right—or wrong—are critical. Hence, recognizing and harnessing the power of randomness isn't merely a theoretical exercise; it’s a necessity for resilience and adaptability in an ever-changing environment. […]

        Inventory Optimization for Manufacturers, Distributors, and MRO

        • Why MRO Businesses Need Add-on Service Parts Planning & Inventory SoftwareWhy MRO Businesses Need Add-on Service Parts Planning & Inventory Software
          MRO organizations exist in a wide range of industries, including public transit, electrical utilities, wastewater, hydro power, aviation, and mining. To get their work done, MRO professionals use Enterprise Asset Management (EAM) and Enterprise Resource Planning (ERP) systems. These systems are designed to do a lot of jobs. Given their features, cost, and extensive implementation requirements, there is an assumption that EAM and ERP systems can do it all. In this post, we summarize the need for add-on software that addresses specialized analytics for inventory optimization, forecasting, and service parts planning. […]
        • Spare-parts-demand-forecasting-a-different-perspective-for-planning-service-partsThe Forecast Matters, but Maybe Not the Way You Think
          True or false: The forecast doesn't matter to spare parts inventory management. At first glance, this statement seems obviously false. After all, forecasts are crucial for planning stock levels, right? It depends on what you mean by a “forecast”. If you mean an old-school single-number forecast (“demand for item CX218b will be 3 units next week and 6 units the week after”), then no. If you broaden the meaning of forecast to include a probability distribution taking account of uncertainties in both demand and supply, then yes. […]
        • Whyt MRO Businesses Should Care about Excess InventoryWhy MRO Businesses Should Care About Excess Inventory
          Do MRO companies genuinely prioritize reducing excess spare parts inventory? From an organizational standpoint, our experience suggests not necessarily. Boardroom discussions typically revolve around expanding fleets, acquiring new customers, meeting service level agreements (SLAs), modernizing infrastructure, and maximizing uptime. In industries where assets supported by spare parts cost hundreds of millions or generate significant revenue (e.g., mining or oil & gas), the value of the inventory just doesn’t raise any eyebrows, and organizations tend to overlook massive amounts of excessive inventory. […]
        • Top Differences between Inventory Planning for Finished Goods and for MRO and Spare PartsTop Differences Between Inventory Planning for Finished Goods and for MRO and Spare Parts
          In today’s competitive business landscape, companies are constantly seeking ways to improve their operational efficiency and drive increased revenue. Optimizing service parts management is an often-overlooked aspect that can have a significant financial impact. Companies can improve overall efficiency and generate significant financial returns by effectively managing spare parts inventory. This article will explore the economic implications of optimized service parts management and how investing in Inventory Optimization and Demand Planning Software can provide a competitive advantage. […]

          Inventory optimization has become an even higher priority in recent months for many of our customers. Some are finding their products in vastly greater demand. Cloud computing companies with unique server and hardware parts, e-commerce, online retailers, home and office supply companies, onsite furniture, power utilities, intensive assets maintenance or warehousing for water supply companies have increased their activity during the pandemic. Garages selling car parts and truck parts, pharmaceuticals, healthcare or medical supply manufacturers and safety product suppliers are dealing with increasing demand. Delivery service companies, cleaning services, liquor stores and canned or jarred goods warehouses, home improvement stores, gardening suppliers, yard care companies, hardware, kitchen and baking supplies stores, home furniture suppliers with high demand are facing stockouts, long lead times, inventory shortage costs, higher operating costs and ordering costs.

          How to Choose a Target Service Level to Optimize Inventory

          The Smart Forecaster

           Pursuing best practices in demand planning,

          forecasting and inventory optimization

          Summary

          Setting a target service level or fill rate is a strategic decision about inventory risk management. Choosing service levels can be difficult. Relevant factors include current service levels, replenishment lead times, cost constraints, the pain inflicted by shortages on you and your customers, and your competitive position. Target setting is often best approached as a collaboration among operations, sales and finance. Inventory optimization software is an essential tool in the process.

          Service Level Choices

          Service level is the probability that no shortages occur between when you order more stock and when it arrives on the shelf. The reasonable range of service levels is from about 70% to 99%. Levels below 70% may signal that you don’t care about or can’t handle your customers. Levels of 100% are almost never appropriate and usually indicate a hugely bloated inventory.

          Factors Influencing Choice of Service Level

          Several factors influence the choice of service level for an inventory item. Here are some of the more important.

          Current service levels:
          A reasonable place to start is to find out what your current service levels are for each item and overall. If you are already in good shape, then the job becomes the easier one of tweaking an already-good solution. If you are in bad shape now, then setting service levels can be more difficult. Surprisingly few companies have data on this important metric across their whole fleet of inventory items. What often happens is that reorder points grow willy-nilly from choices made in corporate pre-history and are rarely, sometimes never, systematically reviewed and updated. Since reorder points are a major determinant of service levels, it follows that service levels “just happen”. Inventory optimization software can convert your current reorder points and lead times into solid estimates of your current service levels. This analysis often reveals subset of items with service levels either too high or too low, in which case you have guidance about which items to adjust down or up, respectively.

          Replenishment lead times:
          Some companies adjust service levels to match replenishment lead times. If it takes a long time to make or buy an item, then it takes a long time to recover from a shortage. Accordingly, they bump up service levels on long-lead-time items and reduce them on items for which backlogs will be brief.

          Cost constraints:
          Inventory optimization software can find the lowest-cost ways to hit high service level targets, but aggressive targets inevitably imply higher costs. You may find that costs constrain your choice of service level targets. Costs come in various flavors. “Inventory investment” is the dollar value of inventory. “Operating costs” include both holding costs and ordering costs. Constraints on inventory investment are often imposed on inventory executives and always imply ceilings on service level targets; software can make these relationships explicit but not take away the necessity of choice. It is less common to hear of ceilings on operating costs, but they are always at least a secondary factor arguing for lower service levels.

          Shortage costs:
          Shortage costs depend on whether your shortage policy calls for backorders or lost sales. In either case, shortage costs work counter to inventory investment and operating costs by arguing for higher service levels. These costs may not always be expressed in dollar terms, as in the case of medical/surgical supplies, where shortage costs are denominated in morbidity and mortality.

          Competition:
          The closer your company is to dominating its market, the more you can ease back on service levels to save money. However, easing back too far carries risks: It encourages potential customers to look elsewhere, and it encourages competitors. Conversely, high product availability can go far to bolstering the position of a minor player.

          Collaborative Targeting

          Inventory executives may be the ones tasked with setting service level targets, but it may be best to collaborate with other functions when making these calls. Finance can share any “red lines” early in the process, and they should be tasked with estimating holding and ordering costs. Sales can help with estimating shortage costs by explaining likely customer reactions to backlogs or lost sales.

          The Role of Inventory Optimization and Planning Software

          Without inventory optimization software, setting service level targets is pure guesswork: It is impossible to know how any given target will play out in terms of inventory investment, operating costs, shortage costs. The software can compute the detailed, quantitative tradeoff curves required to make informed choices or even recommend the target service level that results in the lowest overall cost considering holding costs, ordering costs, and stock out costs. However, not all software solutions are created equal. You might enter a user defined 99% service level into your inventory planning system or the system could recommend a target service – but it doesn’t mean you will actually hit that stated service level. In fact, you might not even come close to hitting it and achieve a much lower service level. We’ve observed situations where a targeted service level of 99% actually achieved a service level of just 82%! Any decisions made as a result of the target will result in unintended misallocation of inventory, very costly consequences, and lots of explaining to do.So be sure to check out our blog article on how to measure the accuracy of your service level forecast so you don’t make this costly mistake.

          Volume and color boxes in a warehouese


          Leave a Comment

          Related Posts

          The Cost of Spreadsheet Planning

          The Cost of Spreadsheet Planning

          Companies that depend on spreadsheets for demand planning, forecasting, and inventory management are often constrained by the spreadsheet’s inherent limitations. This post examines the drawbacks of traditional inventory management approaches caused by spreadsheets and their associated costs, contrasting these with the significant benefits gained from embracing state-of-the-art planning technologies.

          Finding Your Spot on the Inventory Tradeoff Curve

          Finding Your Spot on the Inventory Tradeoff Curve

          This video blog holds essential insights for those working with the complexities of inventory management. The session focuses on striking the right balance within the inventory tradeoff curve, inviting viewers to understand the deep-seated importance of this equilibrium.

          Why MRO Businesses Need Add-on Service Parts Planning & Inventory Software

          Why MRO Businesses Need Add-on Service Parts Planning & Inventory Software

          MRO organizations exist in a wide range of industries, including public transit, electrical utilities, wastewater, hydro power, aviation, and mining. To get their work done, MRO professionals use Enterprise Asset Management (EAM) and Enterprise Resource Planning (ERP) systems. These systems are designed to do a lot of jobs. Given their features, cost, and extensive implementation requirements, there is an assumption that EAM and ERP systems can do it all. In this post, we summarize the need for add-on software that addresses specialized analytics for inventory optimization, forecasting, and service parts planning.

          Recent Posts

          • Epicor AI Forecasting and Inventory Technology Combined with Planner Knowledge for InsightsSmart Software to Present at Epicor Insights 2024
            Smart Software will present at this year's Epicor Insights event in Nashville. If you plan to attend this year, please join us at booth #13 or #501, and learn more about Epicor Smart Inventory Planning and Optimization. . […]
          • Looking for Trouble in Your Inventory DataLooking for Trouble in Your Inventory Data
            In this video blog, the spotlight is on a critical aspect of inventory management: the analysis and interpretation of inventory data. The focus is specifically on a dataset from a public transit agency detailing spare parts for buses. […]
          • BAF Case Study SIOP planning Distribution CenterBig Ass Fans Turns to Smart Software as Demand Heats Up
            Big Ass Fans is the best-selling big fan manufacturer in the world, delivering comfort to spaces where comfort seems impossible. BAF had a problem: how to reliably plan production to meet demand. BAF was experiencing a gap between bookings forecasts vs. shipments, and this was impacting revenue and customer satisfaction BAF turned to Smart Software for help. […]
          • The Cost of Doing nothing with your inventory Planning SystemsThe Cost of Spreadsheet Planning
            Companies that depend on spreadsheets for demand planning, forecasting, and inventory management are often constrained by the spreadsheet’s inherent limitations. This post examines the drawbacks of traditional inventory management approaches caused by spreadsheets and their associated costs, contrasting these with the significant benefits gained from embracing state-of-the-art planning technologies. […]
          • Randomness can be an Ally in the Forecasting BattleCan Randomness be an Ally in the Forecasting Battle?
            When we try to understand the complex world of logistics, randomness plays a pivotal role. This introduces an interesting paradox: In a reality where precision and certainty are prized, could the unpredictable nature of supply and demand actually serve as a strategic ally? The quest for accurate forecasts is not just an academic exercise; it's a critical component of operational success across numerous industries. For demand planners who must anticipate product demand, the ramifications of getting it right—or wrong—are critical. Hence, recognizing and harnessing the power of randomness isn't merely a theoretical exercise; it’s a necessity for resilience and adaptability in an ever-changing environment. […]

            Inventory Optimization for Manufacturers, Distributors, and MRO

            • Why MRO Businesses Need Add-on Service Parts Planning & Inventory SoftwareWhy MRO Businesses Need Add-on Service Parts Planning & Inventory Software
              MRO organizations exist in a wide range of industries, including public transit, electrical utilities, wastewater, hydro power, aviation, and mining. To get their work done, MRO professionals use Enterprise Asset Management (EAM) and Enterprise Resource Planning (ERP) systems. These systems are designed to do a lot of jobs. Given their features, cost, and extensive implementation requirements, there is an assumption that EAM and ERP systems can do it all. In this post, we summarize the need for add-on software that addresses specialized analytics for inventory optimization, forecasting, and service parts planning. […]
            • Spare-parts-demand-forecasting-a-different-perspective-for-planning-service-partsThe Forecast Matters, but Maybe Not the Way You Think
              True or false: The forecast doesn't matter to spare parts inventory management. At first glance, this statement seems obviously false. After all, forecasts are crucial for planning stock levels, right? It depends on what you mean by a “forecast”. If you mean an old-school single-number forecast (“demand for item CX218b will be 3 units next week and 6 units the week after”), then no. If you broaden the meaning of forecast to include a probability distribution taking account of uncertainties in both demand and supply, then yes. […]
            • Whyt MRO Businesses Should Care about Excess InventoryWhy MRO Businesses Should Care About Excess Inventory
              Do MRO companies genuinely prioritize reducing excess spare parts inventory? From an organizational standpoint, our experience suggests not necessarily. Boardroom discussions typically revolve around expanding fleets, acquiring new customers, meeting service level agreements (SLAs), modernizing infrastructure, and maximizing uptime. In industries where assets supported by spare parts cost hundreds of millions or generate significant revenue (e.g., mining or oil & gas), the value of the inventory just doesn’t raise any eyebrows, and organizations tend to overlook massive amounts of excessive inventory. […]
            • Top Differences between Inventory Planning for Finished Goods and for MRO and Spare PartsTop Differences Between Inventory Planning for Finished Goods and for MRO and Spare Parts
              In today’s competitive business landscape, companies are constantly seeking ways to improve their operational efficiency and drive increased revenue. Optimizing service parts management is an often-overlooked aspect that can have a significant financial impact. Companies can improve overall efficiency and generate significant financial returns by effectively managing spare parts inventory. This article will explore the economic implications of optimized service parts management and how investing in Inventory Optimization and Demand Planning Software can provide a competitive advantage. […]

              How to Choose a Target Service Level

              The Smart Forecaster

               Pursuing best practices in demand planning,

              forecasting and inventory optimization

              Summary

              Setting a target service level or fill rate is a strategic decision about inventory risk management. Choosing service levels can be difficult. Relevant factors include current service levels, replenishment lead times, cost constraints, the pain inflicted by shortages on you and your customers, and your competitive position. Target setting is often best approached as a collaboration among operations, sales and finance. Inventory optimization software is an essential tool in the process.

              Service Level Choices

              Service level is the probability that no shortages occur between when you order more stock and when it arrives on the shelf. The reasonable range of service levels is from about 70% to 99%. Levels below 70% may signal that you don’t care about or can’t handle your customers. Levels of 100% are almost never appropriate and usually indicate a hugely bloated inventory.

              Factors Influencing Choice of Service Level

              Several factors influence the choice of service level for an inventory item. Here are some of the more important.

              Current service levels:
              A reasonable place to start is to find out what your current service levels are for each item and overall. If you are already in good shape, then the job becomes the easier one of tweaking an already-good solution. If you are in bad shape now, then setting service levels can be more difficult. Surprisingly few companies have data on this important metric across their whole fleet of inventory items. What often happens is that reorder points grow willy-nilly from choices made in corporate pre-history and are rarely, sometimes never, systematically reviewed and updated. Since reorder points are a major determinant of service levels, it follows that service levels “just happen”. Inventory optimization software can convert your current reorder points and lead times into solid estimates of your current service levels. This analysis often reveals subset of items with service levels either too high or too low, in which case you have guidance about which items to adjust down or up, respectively.

              Replenishment lead times:
              Some companies adjust service levels to match replenishment lead times. If it takes a long time to make or buy an item, then it takes a long time to recover from a shortage. Accordingly, they bump up service levels on long-lead-time items and reduce them on items for which backlogs will be brief.

              Cost constraints:
              Inventory optimization software can find the lowest-cost ways to hit high service level targets, but aggressive targets inevitably imply higher costs. You may find that costs constrain your choice of service level targets. Costs come in various flavors. “Inventory investment” is the dollar value of inventory. “Operating costs” include both holding costs and ordering costs. Constraints on inventory investment are often imposed on inventory executives and always imply ceilings on service level targets; software can make these relationships explicit but not take away the necessity of choice. It is less common to hear of ceilings on operating costs, but they are always at least a secondary factor arguing for lower service levels.

              Shortage costs:
              Shortage costs depend on whether your shortage policy calls for backorders or lost sales. In either case, shortage costs work counter to inventory investment and operating costs by arguing for higher service levels. These costs may not always be expressed in dollar terms, as in the case of medical/surgical supplies, where shortage costs are denominated in morbidity and mortality.

              Competition:
              The closer your company is to dominating its market, the more you can ease back on service levels to save money. However, easing back too far carries risks: It encourages potential customers to look elsewhere, and it encourages competitors. Conversely, high product availability can go far to bolstering the position of a minor player.

              Collaborative Targeting

              Inventory executives may be the ones tasked with setting service level targets, but it may be best to collaborate with other functions when making these calls. Finance can share any “red lines” early in the process, and they should be tasked with estimating holding and ordering costs. Sales can help with estimating shortage costs by explaining likely customer reactions to backlogs or lost sales.

              The Role of Inventory Optimization and Planning Software

              Without inventory optimization software, setting service level targets is pure guesswork: It is impossible to know how any given target will play out in terms of inventory investment, operating costs, shortage costs. The software can compute the detailed, quantitative tradeoff curves required to make informed choices or even recommend the target service level that results in the lowest overall cost considering holding costs, ordering costs, and stock out costs. However, not all software solutions are created equal. You might enter a user defined 99% service level into your inventory planning system or the system could recommend a target service – but it doesn’t mean you will actually hit that stated service level. In fact, you might not even come close to hitting it and achieve a much lower service level. We’ve observed situations where a targeted service level of 99% actually achieved a service level of just 82%! Any decisions made as a result of the target will result in unintended misallocation of inventory, very costly consequences, and lots of explaining to do. So be sure to check out our next blog article on how to measure the accuracy of your service level forecast so you don’t make this costly mistake.

              Leave a Comment

              Related Posts

              The Cost of Spreadsheet Planning

              The Cost of Spreadsheet Planning

              Companies that depend on spreadsheets for demand planning, forecasting, and inventory management are often constrained by the spreadsheet’s inherent limitations. This post examines the drawbacks of traditional inventory management approaches caused by spreadsheets and their associated costs, contrasting these with the significant benefits gained from embracing state-of-the-art planning technologies.

              Finding Your Spot on the Inventory Tradeoff Curve

              Finding Your Spot on the Inventory Tradeoff Curve

              This video blog holds essential insights for those working with the complexities of inventory management. The session focuses on striking the right balance within the inventory tradeoff curve, inviting viewers to understand the deep-seated importance of this equilibrium.

              Why MRO Businesses Need Add-on Service Parts Planning & Inventory Software

              Why MRO Businesses Need Add-on Service Parts Planning & Inventory Software

              MRO organizations exist in a wide range of industries, including public transit, electrical utilities, wastewater, hydro power, aviation, and mining. To get their work done, MRO professionals use Enterprise Asset Management (EAM) and Enterprise Resource Planning (ERP) systems. These systems are designed to do a lot of jobs. Given their features, cost, and extensive implementation requirements, there is an assumption that EAM and ERP systems can do it all. In this post, we summarize the need for add-on software that addresses specialized analytics for inventory optimization, forecasting, and service parts planning.

              Recent Posts

              • Epicor AI Forecasting and Inventory Technology Combined with Planner Knowledge for InsightsSmart Software to Present at Epicor Insights 2024
                Smart Software will present at this year's Epicor Insights event in Nashville. If you plan to attend this year, please join us at booth #13 or #501, and learn more about Epicor Smart Inventory Planning and Optimization. . […]
              • Looking for Trouble in Your Inventory DataLooking for Trouble in Your Inventory Data
                In this video blog, the spotlight is on a critical aspect of inventory management: the analysis and interpretation of inventory data. The focus is specifically on a dataset from a public transit agency detailing spare parts for buses. […]
              • BAF Case Study SIOP planning Distribution CenterBig Ass Fans Turns to Smart Software as Demand Heats Up
                Big Ass Fans is the best-selling big fan manufacturer in the world, delivering comfort to spaces where comfort seems impossible. BAF had a problem: how to reliably plan production to meet demand. BAF was experiencing a gap between bookings forecasts vs. shipments, and this was impacting revenue and customer satisfaction BAF turned to Smart Software for help. […]
              • The Cost of Doing nothing with your inventory Planning SystemsThe Cost of Spreadsheet Planning
                Companies that depend on spreadsheets for demand planning, forecasting, and inventory management are often constrained by the spreadsheet’s inherent limitations. This post examines the drawbacks of traditional inventory management approaches caused by spreadsheets and their associated costs, contrasting these with the significant benefits gained from embracing state-of-the-art planning technologies. […]
              • Randomness can be an Ally in the Forecasting BattleCan Randomness be an Ally in the Forecasting Battle?
                When we try to understand the complex world of logistics, randomness plays a pivotal role. This introduces an interesting paradox: In a reality where precision and certainty are prized, could the unpredictable nature of supply and demand actually serve as a strategic ally? The quest for accurate forecasts is not just an academic exercise; it's a critical component of operational success across numerous industries. For demand planners who must anticipate product demand, the ramifications of getting it right—or wrong—are critical. Hence, recognizing and harnessing the power of randomness isn't merely a theoretical exercise; it’s a necessity for resilience and adaptability in an ever-changing environment. […]

                Inventory Optimization for Manufacturers, Distributors, and MRO

                • Why MRO Businesses Need Add-on Service Parts Planning & Inventory SoftwareWhy MRO Businesses Need Add-on Service Parts Planning & Inventory Software
                  MRO organizations exist in a wide range of industries, including public transit, electrical utilities, wastewater, hydro power, aviation, and mining. To get their work done, MRO professionals use Enterprise Asset Management (EAM) and Enterprise Resource Planning (ERP) systems. These systems are designed to do a lot of jobs. Given their features, cost, and extensive implementation requirements, there is an assumption that EAM and ERP systems can do it all. In this post, we summarize the need for add-on software that addresses specialized analytics for inventory optimization, forecasting, and service parts planning. […]
                • Spare-parts-demand-forecasting-a-different-perspective-for-planning-service-partsThe Forecast Matters, but Maybe Not the Way You Think
                  True or false: The forecast doesn't matter to spare parts inventory management. At first glance, this statement seems obviously false. After all, forecasts are crucial for planning stock levels, right? It depends on what you mean by a “forecast”. If you mean an old-school single-number forecast (“demand for item CX218b will be 3 units next week and 6 units the week after”), then no. If you broaden the meaning of forecast to include a probability distribution taking account of uncertainties in both demand and supply, then yes. […]
                • Whyt MRO Businesses Should Care about Excess InventoryWhy MRO Businesses Should Care About Excess Inventory
                  Do MRO companies genuinely prioritize reducing excess spare parts inventory? From an organizational standpoint, our experience suggests not necessarily. Boardroom discussions typically revolve around expanding fleets, acquiring new customers, meeting service level agreements (SLAs), modernizing infrastructure, and maximizing uptime. In industries where assets supported by spare parts cost hundreds of millions or generate significant revenue (e.g., mining or oil & gas), the value of the inventory just doesn’t raise any eyebrows, and organizations tend to overlook massive amounts of excessive inventory. […]
                • Top Differences between Inventory Planning for Finished Goods and for MRO and Spare PartsTop Differences Between Inventory Planning for Finished Goods and for MRO and Spare Parts
                  In today’s competitive business landscape, companies are constantly seeking ways to improve their operational efficiency and drive increased revenue. Optimizing service parts management is an often-overlooked aspect that can have a significant financial impact. Companies can improve overall efficiency and generate significant financial returns by effectively managing spare parts inventory. This article will explore the economic implications of optimized service parts management and how investing in Inventory Optimization and Demand Planning Software can provide a competitive advantage. […]