Onze klanten hebben doorgaans gekozen voor één manier om hun voorraad serviceonderdelen te beheren. De professor in mij zou graag willen denken dat het gekozen voorraadbeleid een beredeneerde keuze was uit de weloverwogen alternatieven, maar het is waarschijnlijker dat het gewoon zo is gebeurd. Misschien had de inventarishoncho van lang geleden een favoriet en bleef die keuze hangen. Misschien gebruikte iemand een EAM- of ERP-systeem dat maar één keuze bood. Misschien zijn er enkele gissingen gedaan, gebaseerd op de toenmalige omstandigheden.
De concurrenten
Het komt maar zelden voor dat bedrijven deze keuzes op lukrake manieren maken. Maar met moderne planningssoftware voor serviceonderdelen kunt u systematischer uw keuzes maken. Dit bericht demonstreert deze stelling door objectieve vergelijkingen te maken tussen drie populaire voorraadbeleidslijnen: Bestel tot aan, Bestelpunt/Bestelhoeveelheid en Min/Max. Ik heb elk van deze beleidsmaatregelen hierin besproken videoblog.
- Bestel tot. Dit is een periodiek beoordelingsbeleid waarbij elke T dagen de voorhanden voorraad wordt opgeteld en een bestelling van willekeurige grootte wordt geplaatst om het voorraadniveau weer op S-eenheden te brengen.
- Q, R of bestelpunt/bestelhoeveelheid. Q, R is een continu beoordelingsbeleid waarbij de voorraad elke dag wordt opgeteld. Als er Q of minder eenheden beschikbaar zijn, wordt een bestelling van vaste grootte geplaatst voor R meer eenheden.
- Min, Max is een ander continu beoordelingsbeleid waarbij de inventaris elke dag wordt opgeteld. Als er Min of minder eenheden beschikbaar zijn, wordt er een bestelling geplaatst om het voorraadniveau weer op Max eenheden te brengen.
Volgens de inventaristheorie worden deze keuzes gerangschikt in oplopende volgorde van effectiviteit. De eerste optie, Order Up To, is duidelijk de eenvoudigste en goedkoopste om te implementeren, maar sluit de ogen voor wat er gedurende langere tijd gebeurt. Het opleggen van een bepaald tijdsverloop tussen bestellingen maakt het in theorie minder flexibel. De twee continue beoordelingsopties houden daarentegen voortdurend in de gaten wat er gebeurt, zodat ze sneller kunnen reageren op mogelijke voorraadtekorten. De Min/Max-optie is in theorie flexibeler dan de optie die gebruikmaakt van een vast bestelaantal, omdat de omvang van de bestelling dynamisch verandert om aan de vraag te voldoen.
Dat is de theorie. Dit artikel onderzoekt bewijsmateriaal uit onderlinge vergelijkingen om de theorie te controleren en concrete cijfers te geven over de relatieve prestaties van de drie beleidsmaatregelen.
De betekenis van “Beste”
Hoe moeten we de score bijhouden in dit toernooi? Als u een regelmatige lezer bent van dit Smart Forecaster-blog, weet u dat de kern van voorraadplanning een touwtrekken is tussen twee tegengestelde doelstellingen: de voorraad beperkt houden versus de beschikbaarheidsstatistieken van artikelen, zoals het serviceniveau, hoog houden.
Om de zaken te vereenvoudigen, zullen we ‘één getal berekenen dat alles regelt’: de gemiddelde bedrijfskosten. Het winnende beleid zal het beleid zijn met het laagste gemiddelde.
Dit gemiddelde is de som van drie componenten: de kosten van het aanhouden van voorraad (“voorraadkosten”), de kosten van het bestellen van aanvullingseenheden (“bestelkosten”) en de kosten van het mislopen van een verkoop (“tekortkosten”). Om het concreet te maken zijn we uitgegaan van de volgende aannames:
- Elk serviceonderdeel heeft een waarde van $1.000.
- De jaarlijkse bewaarkosten bedragen 10% van de artikelwaarde, of $100 per jaar per eenheid.
- Het verwerken van elke aanvulorder kost $20 per bestelling.
- Elke gevraagde maar niet geleverde eenheid kost de waarde van het onderdeel, $1.000.
Voor de eenvoud zullen we naar de gemiddelde bedrijfskosten verwijzen als eenvoudigweg “de kosten”.
Uiteraard kunnen de laagste gemiddelde kosten worden bereikt door uit het bedrijf te stappen. De concurrentie vereiste dus een prestatiebeperking op het gebied van de beschikbaarheid van artikelen: elke optie moest een opvullingspercentage van minimaal 99% behalen.
De alternatieven: laat het achterwege
Een belangrijk contextelement is of stockouts resulteren in verliezen of nabestellingen. Ervan uitgaande dat het betreffende serviceonderdeel cruciaal is, zijn we ervan uitgegaan dat niet-uitgevoerde bestellingen verloren gaan, wat betekent dat een concurrent de bestelling vervult. In een MRO-omgeving betekent dit extra downtime als gevolg van voorraadtekorten.
Om de alternatieven te vergelijken, hebben we onze voorspellende modelleringsengine gebruikt om er een groot aantal uit te voeren Monte Carlo-simulaties. Elke simulatie omvatte het specificeren van de parameterwaarden van elk beleid (bijvoorbeeld de Min- en Max-waarden), het genereren van een vraagscenario, het invoeren daarvan in de logica van het beleid en het meten van de resulterende kosten, gemiddeld over 365 dagen gebruik. Door dit proces 1000 keer te herhalen en het gemiddelde te nemen van de 1000 resulterende kosten, ontstond het eindresultaat voor elke polis.
Om de vergelijking eerlijk te maken, moest elk alternatief worden ontworpen voor de beste prestaties. Daarom doorzochten we de ‘ontwerpruimte’ van elke polis om het ontwerp met de laagste kosten te vinden. Dit vereiste het herhalen van het proces dat in de vorige paragraaf is beschreven voor veel paren parameterwaarden en het identificeren van het paar dat de verloren gemiddelde jaarlijkse bedrijfskosten opleverde.
Met behulp van de algoritmen in Smart Inventory Optimization (SIOTM) hebben we onderlinge vergelijkingen gemaakt op basis van de volgende aannames over vraag en aanbod:
- Er werd aangenomen dat de vraag naar artikelen intermitterend en zeer variabel was, maar relatief eenvoudig omdat er geen sprake was van trends of seizoensinvloeden, zoals vaak het geval is voor serviceonderdelen. De dagelijkse gemiddelde vraag bedroeg 5 eenheden met een grote standaardafwijking van 13 eenheden. Figuur 1 toont een voorbeeld van de vraag over een jaar. We hebben gekozen voor een zeer uitdagend vraagpatroon, waarbij op sommige dagen de vraag 10 tot zelfs 20 keer zo groot is als de gemiddelde vraag.
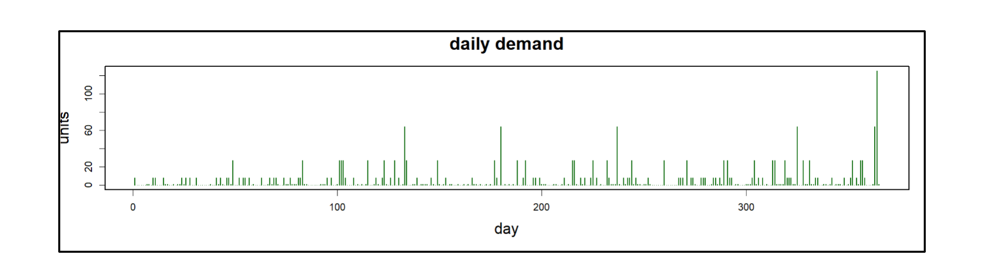
Figuur 1: Er werd aangenomen dat de dagelijkse vraag naar onderdelen intermitterend en zeer piekerig was.
- De levertijden van leveranciers bedroegen destijds 14 dagen (75%) en anders 21 dagen. Dit weerspiegelt het feit dat er altijd onzekerheid bestaat in de toeleveringsketen.
En de winnaar is…
Klopte de theorie? Soort van'.
Tabel 1 toont de resultaten van de simulatie-experimenten. Voor elk van de drie concurrerende beleidsmaatregelen worden de gemiddelde jaarlijkse bedrijfskosten, de foutmarge (technisch gezien een betrouwbaarheidsinterval van ongeveer 95% voor de gemiddelde kosten) en de ogenschijnlijk beste keuzes voor parameterwaarden weergegeven.
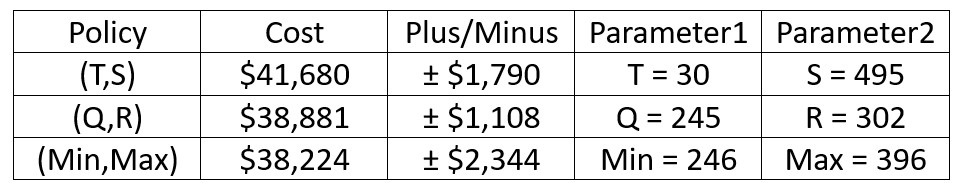
Tabel 1: Resultaten van de gesimuleerde vergelijkingen
De gemiddelde kosten voor de (T,S)-polis wanneer T op 30 dagen is vastgesteld, bedroegen bijvoorbeeld $41.680. Maar de Plus/Minus houdt in dat de resultaten verenigbaar zijn met de “echte” kosten (dwz de schatting op basis van een oneindig aantal simulaties) van ergens tussen $39.890 en $43.650. De reden dat er zoveel statistische onzekerheid is, is de extreem piekerige aard van de vraag in dit voorbeeld.
Tabel 1 laat zien dat in dit voorbeeld de drie beleidsmaatregelen in lijn zijn met de verwachtingen. Nuttigere conclusies zouden echter zijn:
- Wat de gemiddelde kosten betreft, zijn de drie polissen opmerkelijk vergelijkbaar. Door een slimme keuze van parameterwaarden kan men goede resultaten behalen met elk van de drie beleidsmaatregelen.
- Niet weergegeven in Tabel 1, maar duidelijk uit de gedetailleerde simulatieresultaten, is dat slechte keuzes voor parameterwaarden rampzalig kunnen zijn voor elk beleid.
- Het is vermeldenswaard dat het beleid voor periodieke beoordeling (T,S) niet mocht optimaliseren ten opzichte van mogelijke waarden van T. We hebben T op 30 vastgesteld om na te bootsen wat in de praktijk gebruikelijk is, maar degenen die het beleid voor periodieke beoordeling gebruiken, moeten andere beoordelingen overwegen. periodes. Een aanvullend experiment stelde de beoordelingsperiode vast op T = 7 dagen. De gemiddelde kosten in dit scenario werden geminimaliseerd op $36.551 ± $1.668 met S = 343. Dit resultaat is beter dan dat met T = 30 dagen.
- We moeten voorzichtig zijn met het overgeneraliseren van deze resultaten. Ze zijn afhankelijk van de veronderstelde waarden van de drie kostenparameters (vasthouden, bestellen en tekort) en het karakter van het vraagproces.
- Het is mogelijk om experimenten zoals hier weergegeven automatisch uit te voeren Smart Inventory Optimization. Dit betekent dat ook jij ontwerpkeuzes op een rigoureuze manier kunt onderzoeken.